library( dplyr )
URL <- "https://raw.githubusercontent.com/UI-Research/nccs-geo/main/get_census_data.R"
source( URL )

df  <- get_census_data( geo="msa" )      # 918 metro areas, all years
df  <- get_census_data( geo="county" )   # 3,142 counties, all years
df  <- get_census_data( geo="tract" )    # 72,597 tracts, all years

# default format is 'long' (stacked years)
df  <- get_census_data( geo="msa", years=2010:2019 )

# return data in a wide format:
dfw <- get_census_data( geo="msa", years=c(1990,2000,2010), format="wide" )

# available years
c(  1990, 2000, 2007, 2008, 2009, 2010, 2011, 2012,
    2013, 2014, 2015, 2016, 2017, 2018, 2019  )


get_census_data( geo="county", year=2000 ) %>% head()Census Panel 1990-2019
Harmonized Census Data
For convenience, we provide a small set of census variables that have been harmonized into a coherent data panel.
All data in each panel has been harmonized to 2010 geographies (shapefiles) and inflation-adjusted to the year 2021.
Load Data Panel With R
Retrieve the census panel using the following R syntax:
| geoid_2010 | year | total_population | housing_units | occupied | vacant | renter_occ | white_perc | black_perc | asian_perc | hawaiian_perc | american_alaskan_perc | two_or_more_perc | other_perc | rural_perc | bachelors_perc | hispanic_perc | poverty_perc | unemployment | turnover_perc | med_family_income_adj | med_gross_rent_adj | med_household_income_adj | median_value_adj | version |
|---|---|---|---|---|---|---|---|---|---|---|---|---|---|---|---|---|---|---|---|---|---|---|---|---|
| 01001 | 2000 | 43663.68 | 17659.21 | 16000.40 | 1658.81 | 3073.78 | 0.80 | 0.17 | 0.01 | 0 | 0.01 | 0.01 | 0 | 0.45 | 0.18 | 0.01 | 0.11 | 0.05 | 0.18 | 78820.55 | 873.45 | 68336.66 | 154201.04 | v2000 |
| 01003 | 2000 | 140645.80 | 74380.61 | 55422.71 | 18957.89 | 11349.33 | 0.86 | 0.10 | 0.00 | 0 | 0.01 | 0.01 | 0 | 0.54 | 0.23 | 0.02 | 0.10 | 0.04 | 0.16 | 76482.22 | 920.53 | 65458.33 | 199176.96 | v2000 |
| 01005 | 2000 | 29037.90 | 12460.99 | 10409.00 | 2051.99 | 2797.02 | 0.51 | 0.46 | 0.00 | 0 | 0.00 | 0.01 | 0 | 0.71 | 0.11 | 0.02 | 0.27 | 0.06 | 0.14 | 51852.62 | 541.67 | 40830.46 | 111587.73 | v2000 |
| 01007 | 2000 | 20826.06 | 8345.03 | 7421.03 | 924.00 | 1470.01 | 0.76 | 0.22 | 0.00 | 0 | 0.00 | 0.00 | 0 | 0.81 | 0.07 | 0.01 | 0.21 | 0.06 | 0.15 | 60560.08 | 566.07 | 51109.25 | 121348.09 | v2000 |
| 01009 | 2000 | 51038.30 | 21165.14 | 19271.08 | 1894.06 | 3191.92 | 0.92 | 0.01 | 0.00 | 0 | 0.00 | 0.01 | 0 | 0.91 | 0.10 | 0.05 | 0.12 | 0.05 | 0.14 | 67621.99 | 626.29 | 57320.94 | 141186.78 | v2000 |
| 01011 | 2000 | 11700.91 | 4722.15 | 3981.95 | 740.20 | 1016.17 | 0.24 | 0.72 | 0.00 | 0 | 0.00 | 0.00 | 0 | 0.65 | 0.08 | 0.03 | 0.33 | 0.09 | 0.12 | 39033.09 | 527.07 | 33522.82 | 92083.38 | v2000 |
For more details on the data see the data dictionary below and the data aggregation script that generates these statistics.
Note that some variables like “housing_units” represent counts of housing units but appear as fractions here because of the process of apportioning data over time (integer counts are allocated to fractional geographies when geo units are split or combined over time).
Note the difference with the 2010 data since that is the temporal reference period (housing_units and similar count variables appear as integers, not fractions):
| geoid_2010 | year | total_population | housing_units | occupied | vacant | renter_occ | white_perc | black_perc | asian_perc | hawaiian_perc | american_alaskan_perc | two_or_more_perc | other_perc | rural_perc | bachelors_perc | hispanic_perc | poverty_perc | unemployment | turnover_perc | med_family_income_adj | med_gross_rent_adj | med_household_income_adj | median_value_adj | version |
|---|---|---|---|---|---|---|---|---|---|---|---|---|---|---|---|---|---|---|---|---|---|---|---|---|
| 01001 | 2008-2012 | 54590 | 22077 | 19934 | 2143 | 4446 | 0.77 | 0.18 | 0.01 | 0 | 0.00 | 0.01 | 0 | NA | 0.22 | 0.02 | 0.12 | 0.09 | 0.14 | 78978.32 | 986.70 | 63466.16 | 162757.94 | v2010 |
| 01003 | 2008-2012 | 183226 | 103984 | 72751 | 31233 | 18862 | 0.84 | 0.09 | 0.01 | 0 | 0.01 | 0.01 | 0 | NA | 0.28 | 0.04 | 0.13 | 0.08 | 0.17 | 72888.18 | 1031.55 | 59846.30 | 204067.06 | v2010 |
| 01005 | 2008-2012 | 27469 | 11878 | 9423 | 2455 | 3138 | 0.47 | 0.46 | 0.00 | 0 | 0.00 | 0.02 | 0 | NA | 0.15 | 0.05 | 0.26 | 0.14 | 0.17 | 51507.75 | 681.01 | 37637.33 | 104689.12 | v2010 |
| 01007 | 2008-2012 | 22769 | 8958 | 7386 | 1572 | 1407 | 0.75 | 0.22 | 0.00 | 0 | 0.00 | 0.01 | 0 | NA | 0.09 | 0.02 | 0.16 | 0.10 | 0.12 | 52165.16 | 685.73 | 43461.92 | 108111.87 | v2010 |
| 01009 | 2008-2012 | 57466 | 23761 | 21031 | 2730 | 3974 | 0.89 | 0.01 | 0.00 | 0 | 0.00 | 0.01 | 0 | NA | 0.12 | 0.08 | 0.15 | 0.10 | 0.12 | 65211.76 | 693.99 | 53338.34 | 135966.03 | v2010 |
| 01011 | 2008-2012 | 10779 | 4501 | 3740 | 761 | 849 | 0.22 | 0.71 | 0.00 | 0 | 0.00 | 0.01 | 0 | NA | 0.12 | 0.06 | 0.22 | 0.14 | 0.15 | 50464.40 | 584.23 | 40718.99 | 87221.26 | v2010 |
Download CSV Files
You can also download the files directly:
TRACTS
| VINTAGE | DOWNLOAD |
|---|---|
| 1990 | DOWNLOAD |
| 2000 | DOWNLOAD |
| 2007 | DOWNLOAD |
| 2008 | DOWNLOAD |
| 2009 | DOWNLOAD |
| 2010 | DOWNLOAD |
| 2011 | DOWNLOAD |
| 2012 | DOWNLOAD |
| 2013 | DOWNLOAD |
| 2014 | DOWNLOAD |
| 2015 | DOWNLOAD |
| 2016 | DOWNLOAD |
| 2017 | DOWNLOAD |
| 2018 | DOWNLOAD |
| 2019 | DOWNLOAD |
COUNTIES
| VINTAGE | DOWNLOAD |
|---|---|
| 1990 | DOWNLOAD |
| 2000 | DOWNLOAD |
| 2007 | DOWNLOAD |
| 2008 | DOWNLOAD |
| 2009 | DOWNLOAD |
| 2010 | DOWNLOAD |
| 2011 | DOWNLOAD |
| 2012 | DOWNLOAD |
| 2013 | DOWNLOAD |
| 2014 | DOWNLOAD |
| 2015 | DOWNLOAD |
| 2016 | DOWNLOAD |
| 2017 | DOWNLOAD |
| 2018 | DOWNLOAD |
| 2019 | DOWNLOAD |
METRO AREAS (CBSA)
| VINTAGE | DOWNLOAD |
|---|---|
| 1990 | DOWNLOAD |
| 2000 | DOWNLOAD |
| 2007 | DOWNLOAD |
| 2008 | DOWNLOAD |
| 2009 | DOWNLOAD |
| 2010 | DOWNLOAD |
| 2011 | DOWNLOAD |
| 2012 | DOWNLOAD |
| 2013 | DOWNLOAD |
| 2014 | DOWNLOAD |
| 2015 | DOWNLOAD |
| 2016 | DOWNLOAD |
| 2017 | DOWNLOAD |
| 2018 | DOWNLOAD |
| 2019 | DOWNLOAD |
Data Dictionary
The census files include the following variables (some not available in all geographic aggregations).
Details on the variable creation can be found in the data aggregation script.
| variable_name | variable_description |
|---|---|
| year | Year of data |
| geoid | Geographic identifier |
| total_population | Total population |
| housing_units | Number of housing units |
| occupied | Number of occupied housing units |
| vacant | Number of vacant housing units |
| renter_occ | Number of renter occupied units |
| white_perc | Percent of population that is white |
| black_perc | Percent of population that is black |
| asian_perc | Percent of population that is asian |
| hawaiian_perc | Percent of population that is hawaiian |
| american_alaskan_perc | Percent of population that is american indican or alaskan native |
| two_or_more_perc | Percent of population with two or more races |
| other_perc | Percent of population with race classified as other |
| rural_perc | Percent of population living in rural areas |
| bachelors_perc | Percent of population 25 and over that have a bachelors degree or more |
| hispanic_perc | Percent of population that is hispanic |
| poverty_perc | Percent of population for whom poverty status is determined living in poverty |
| unemployment | Percent of population aged 16 or over and in labor force that are unemployed |
| turnover_perc | Percent of population that moved in the past year |
| med_family_income_adj | Median family income, inflation adjusted to 2021 dollars |
| med_gross_rent_adj | Median gross rent, inflation adjusted to 2021 dollars |
| med_household_income_adj | Median household income, inflation adjusted to 2021 dollars |
| median_value_adj | Median housing value, inflation adjusted to 2021 dollars |
Geographic Crosswalks
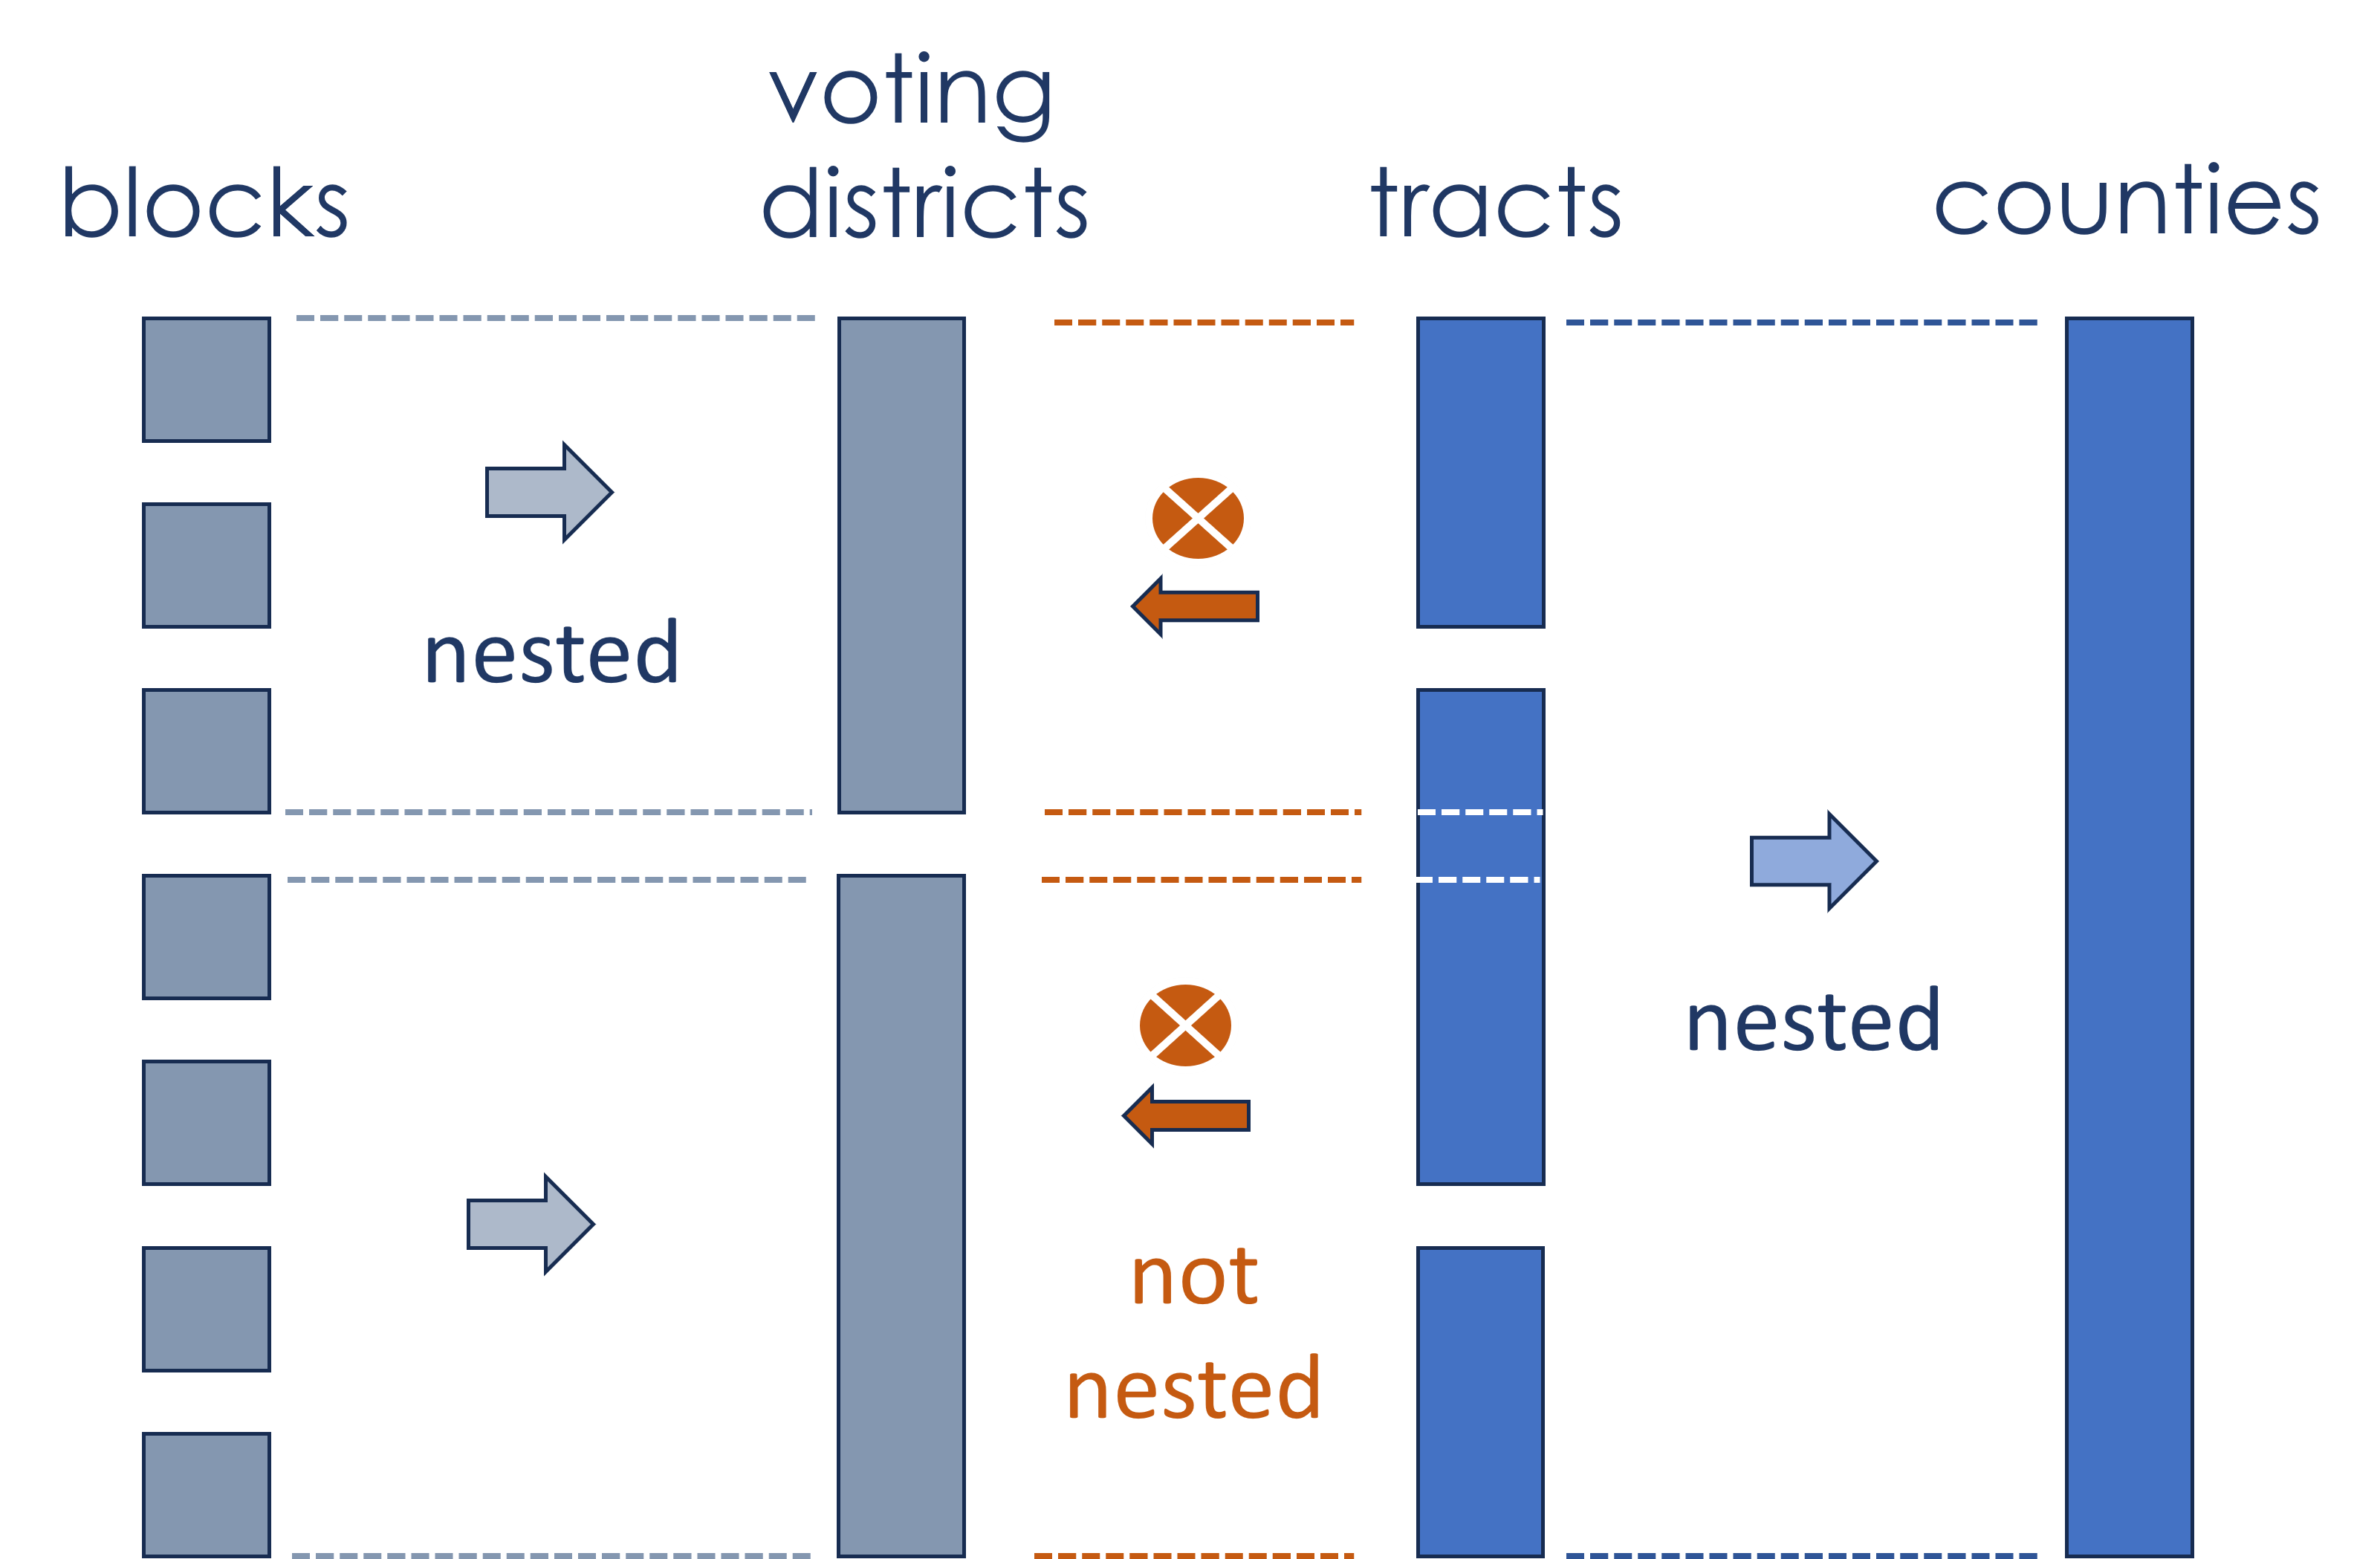
Any census-designated geography consists of a collection of either tracts or blocks. We have created a series of crosswalk files that enable interoperability of census data across different geographic scales.
Two crosswalk files contain geographic IDs that describe the nested hierarchy of 14 distinct geographic levels of aggregation. They help researchers select the most meaningful level of aggregation for their study.
Geographies Derived from Blocks (11,078,297 blocks/rows, 748MB)
- Census Designated Places
- Urban/Rural Areas (Census Defined)
- Urban/Rural Areas (NCES Defined)
- Voting Districts
- ZIP Code equivalents (ZCTAs)
Geographies Derived from Tracts (74,091 tracts/rows, 15MB)
- States (State FIPS)
- Counties (County FIPS)
- Woodard’s Cutural Regions
- American Cultural Regions (Louf et al. 2023)
- Census Regions
- Public Use Microdata Areas (PUMAs)
- Core Based Statistical Areas (CBSAs)
- Combined Statistical Areas (CSAs)