Best Practices for Data Visualization
Data visualization is a mix of science and art. There are some basic guidelines and best practices rooted in our understanding of cognitive psychology, statistics, and human-computer interaction, but these also reflect preferences for different colors, typefaces, layouts, and more.
What Is the Right Chart for Your Data?
Stop! Should it even be a chart?
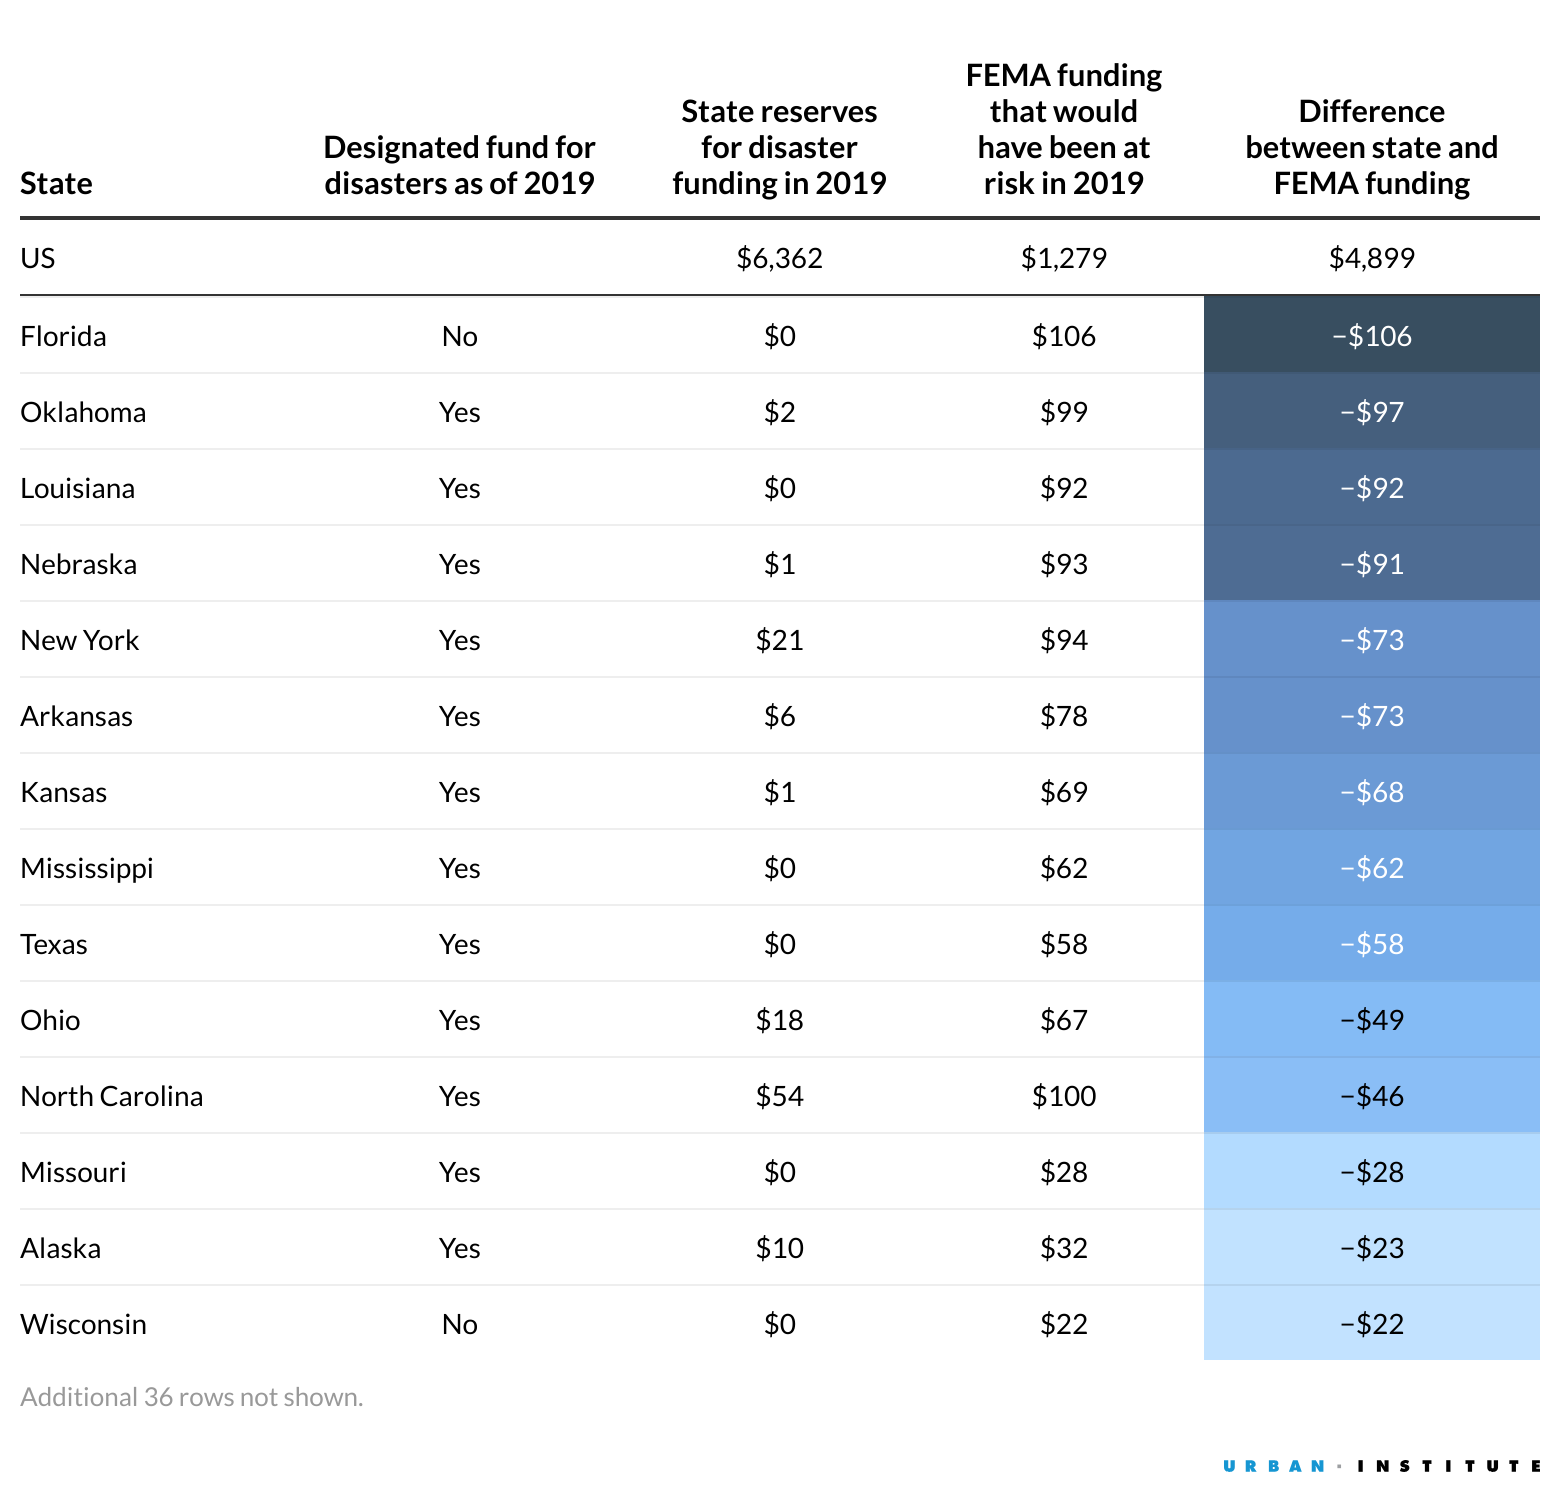
Although charts are great for communicating data, they are not the appropriate tool for every situation. If you find explanatory sentences do a better job of distilling the information you want to convey, consider going without a chart. If your main goal is to present detailed information as opposed to showing patterns, or if it’s important that the reader can accurately determine the values of your data, consider using a table instead. You may also find that simply including a single, large number (commonly known as “big aggregate numbers”) may be sufficient. In these cases, inserting a simple text box or shape in your PowerPoint or Word document will work.
Selecting the appropriate chart type for your data and the message you want to convey is critical to creating a successful data visualization. The table below offers guidance on what types of charts are best suited for different purposes. However, this is not an infallible set of choices, because there is not a one-to-one relationship between data types and graph types; for example, a vertical bar chart can be used to compare categories or show changes over time. The list below should therefore be viewed as a starting resource to guide the graph creator. If you are unsure, reach out to the Data Visualization team to help explore your options.
|
I want to...
|
|
|
Compare values or rankings
|
|
|
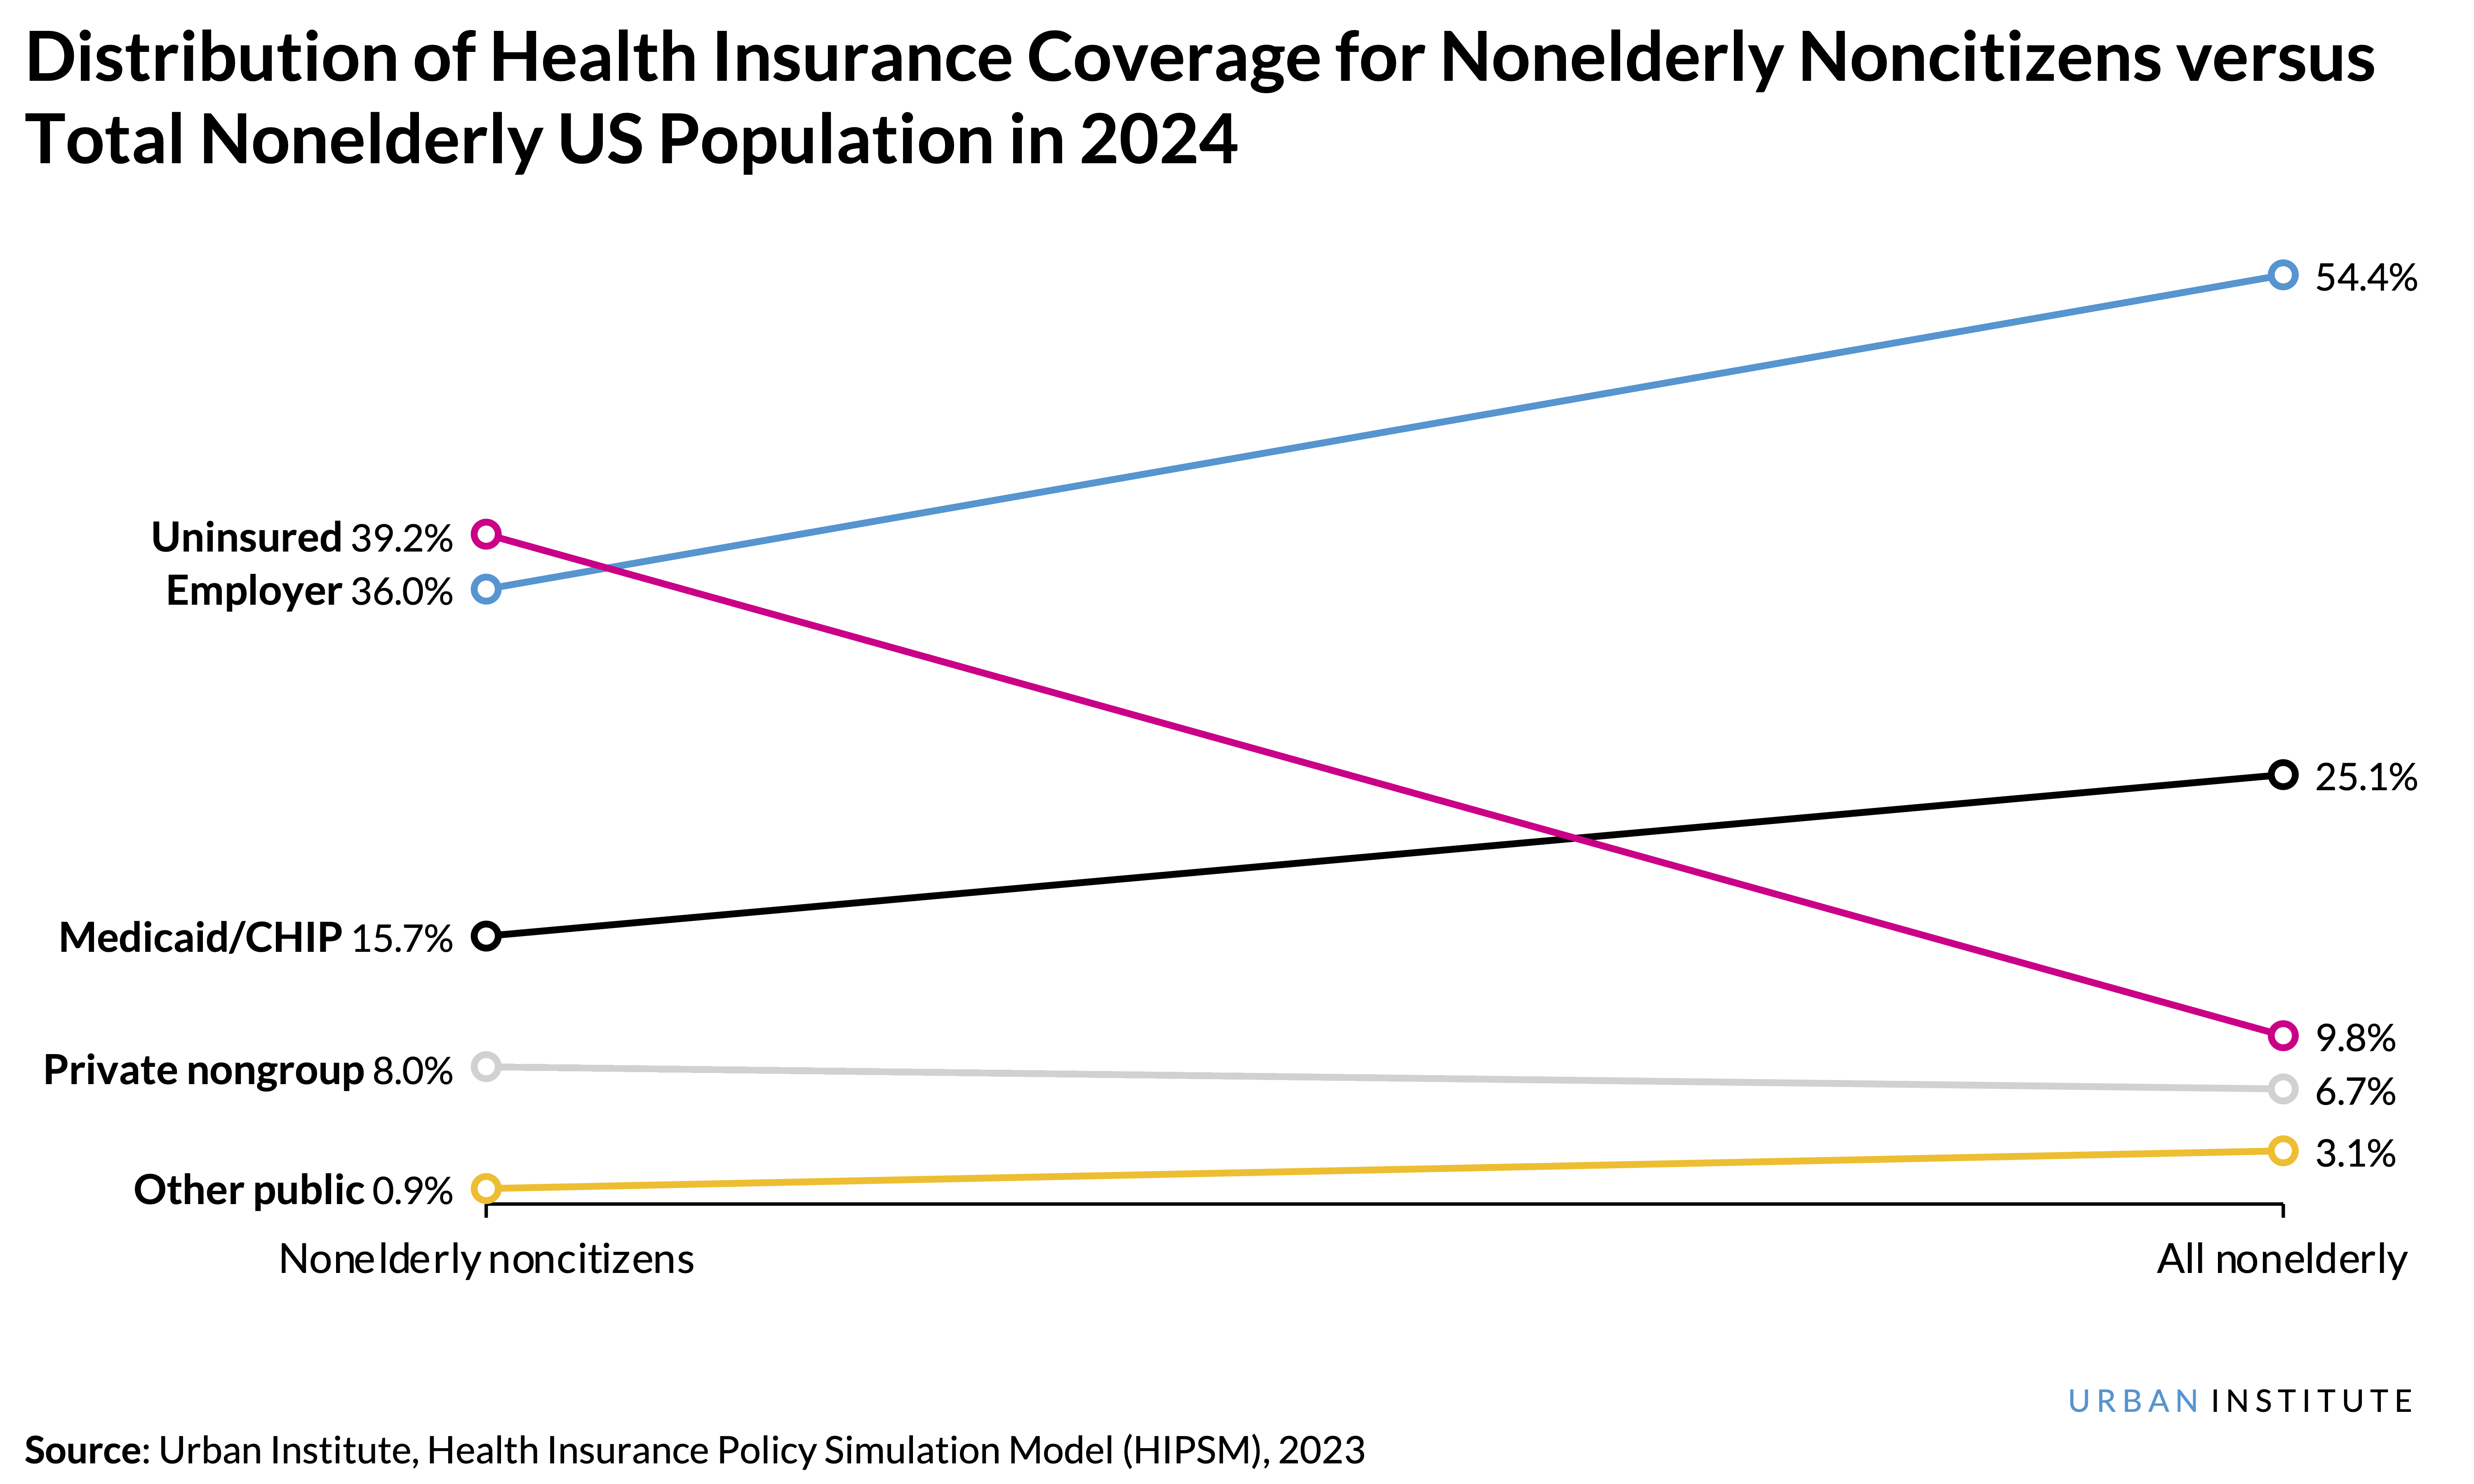
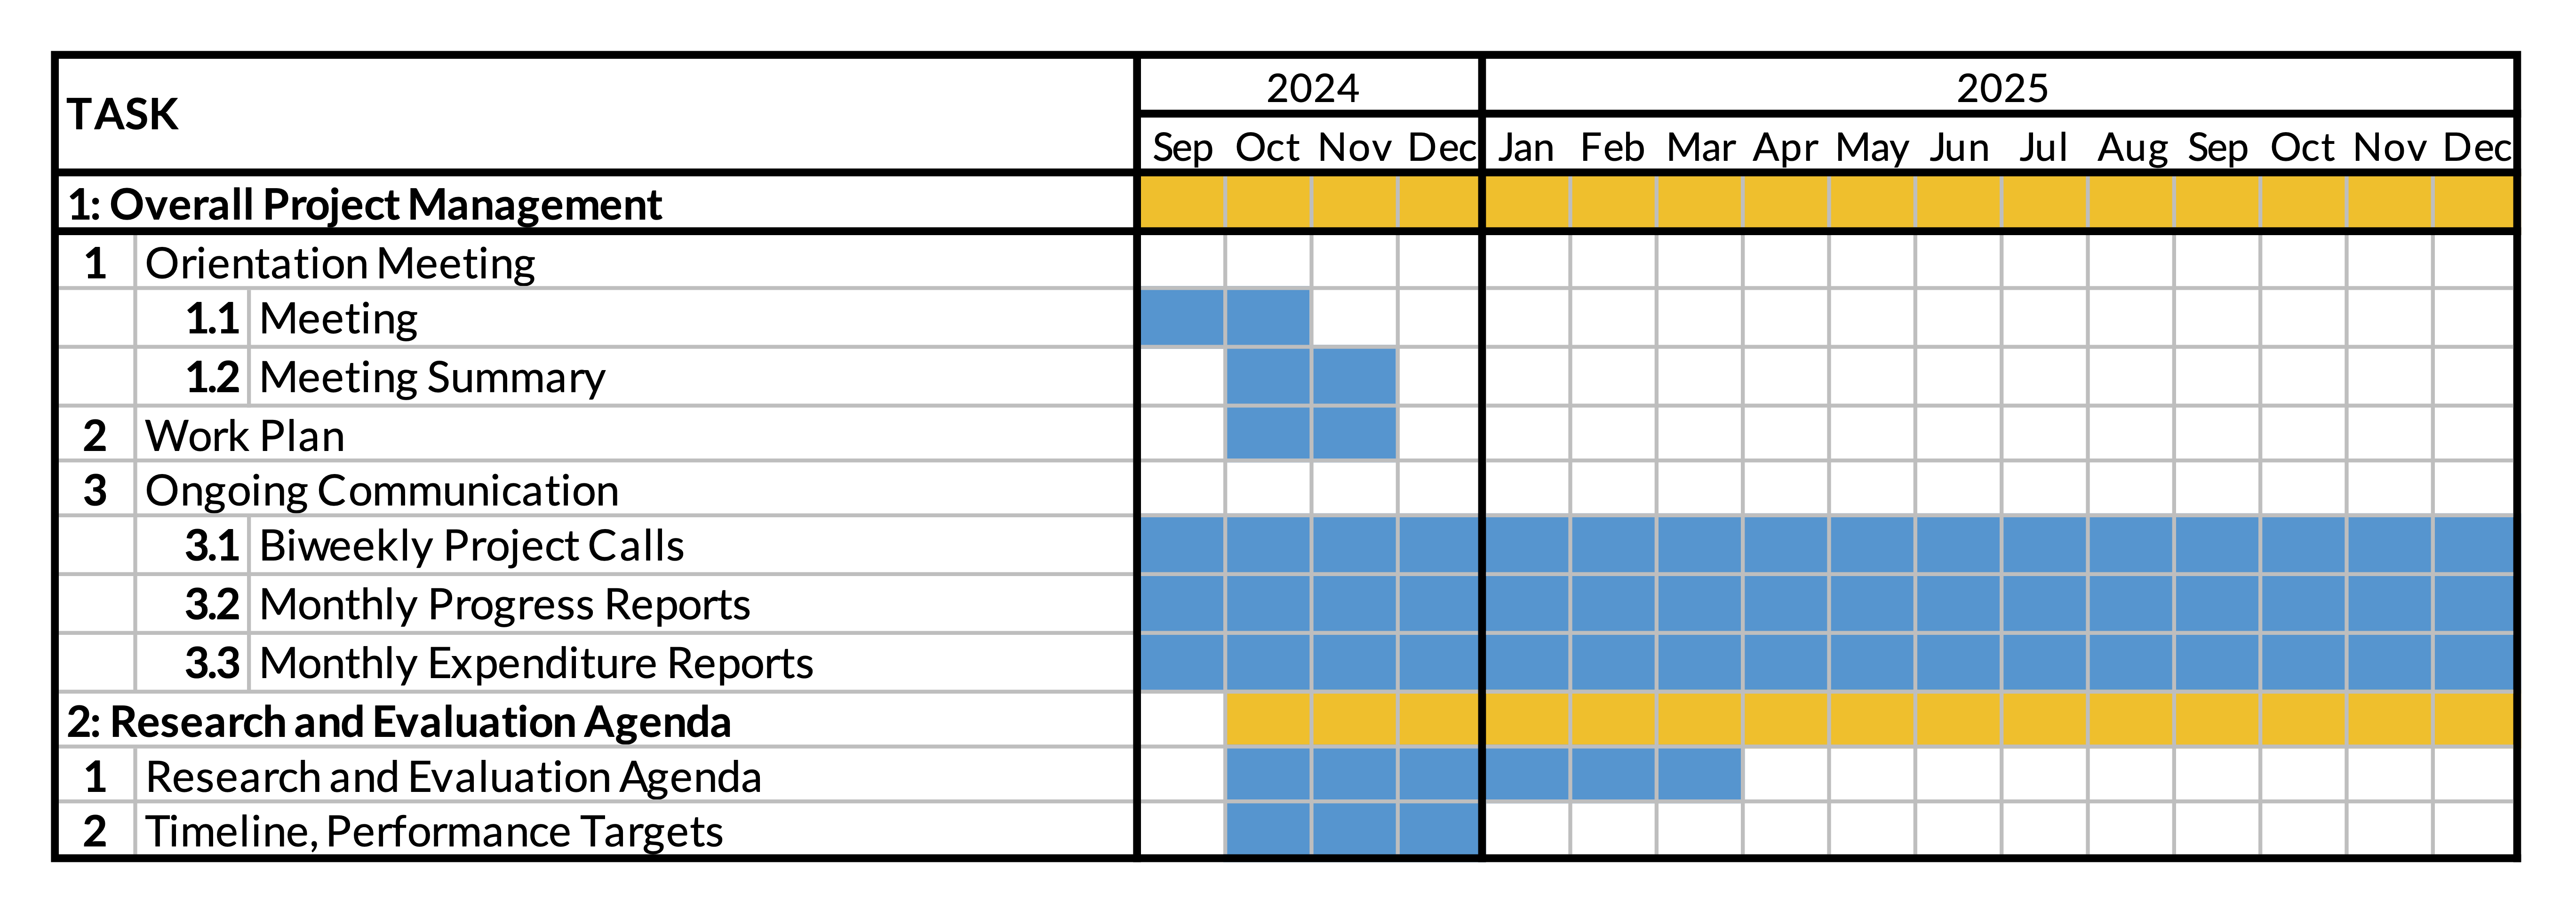
Show trends or change over time
|
|
|
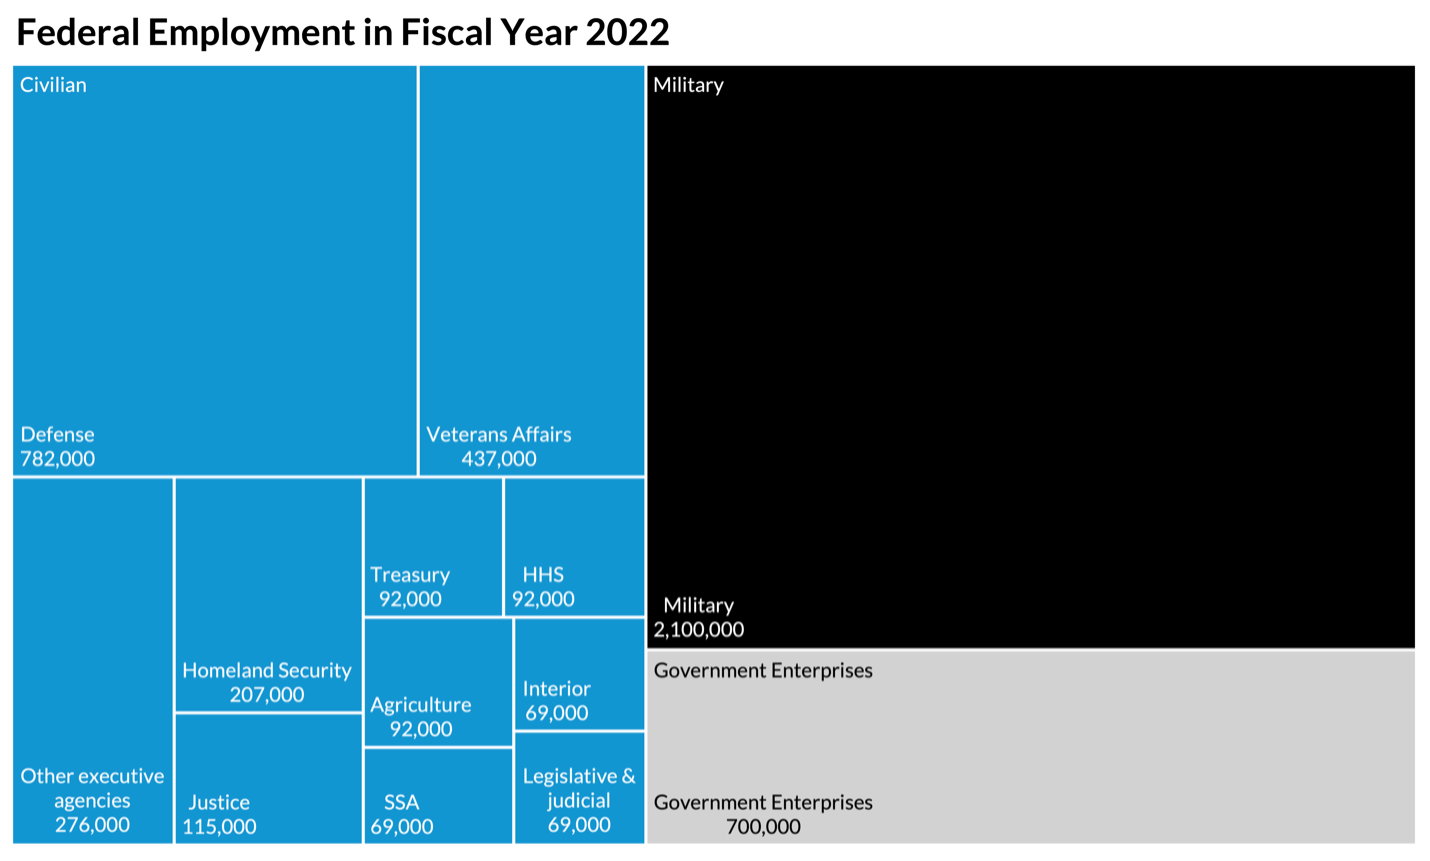
Depict a part-to-whole relationship
|
|
|
Show deviation from a reference point
|
|
|
Show the distribution of values
|
|
Creating Effective Charts
The list of best practices provided here is a set of guidelines derived from years of work, research, and experience.
Keep it simple. Don’t try to stuff every data value into a single graph. This doesn’t mean you need to strip out all your data, but consider what you want your reader to come away with. You might be able to include all your data and highlight a subset of values. For example, consider a line chart with all 50 US states—you could use gray for the majority of states and add color to just the few you want to highlight.
Be consistent. Once you’ve chosen blue to represent one group in one chart, make sure all other charts in your publication or slide deck use blue to represent that group as well. This consistency makes reading and comprehension easier for your reader.
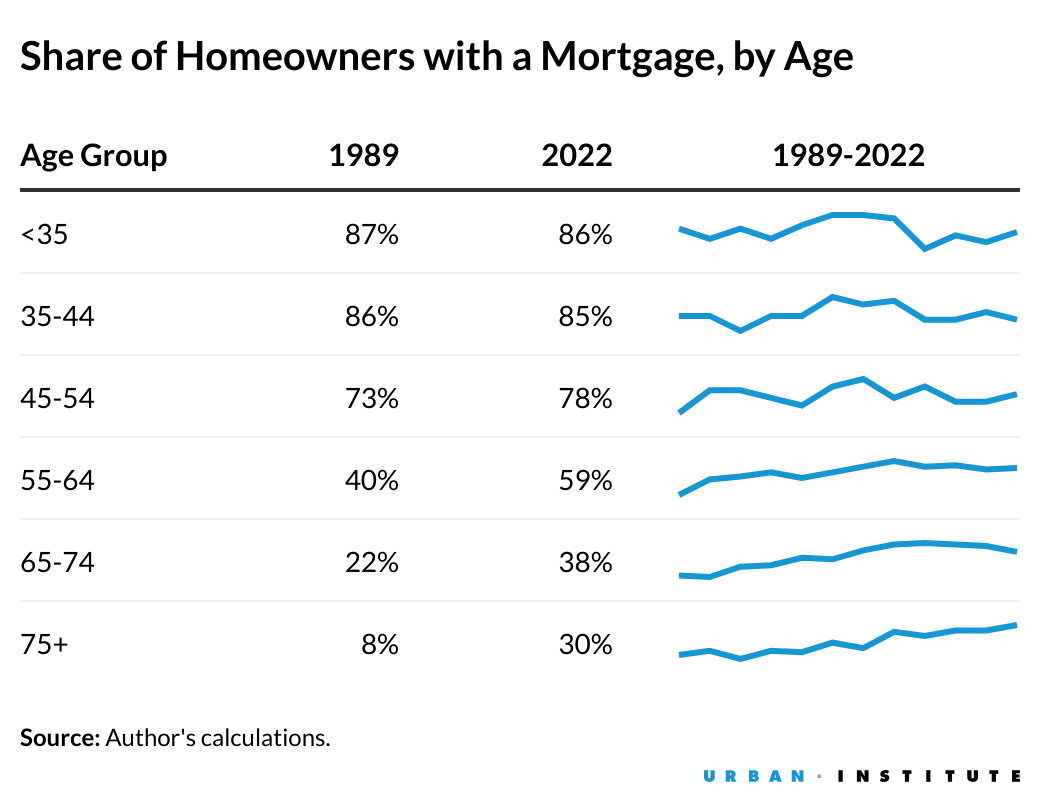
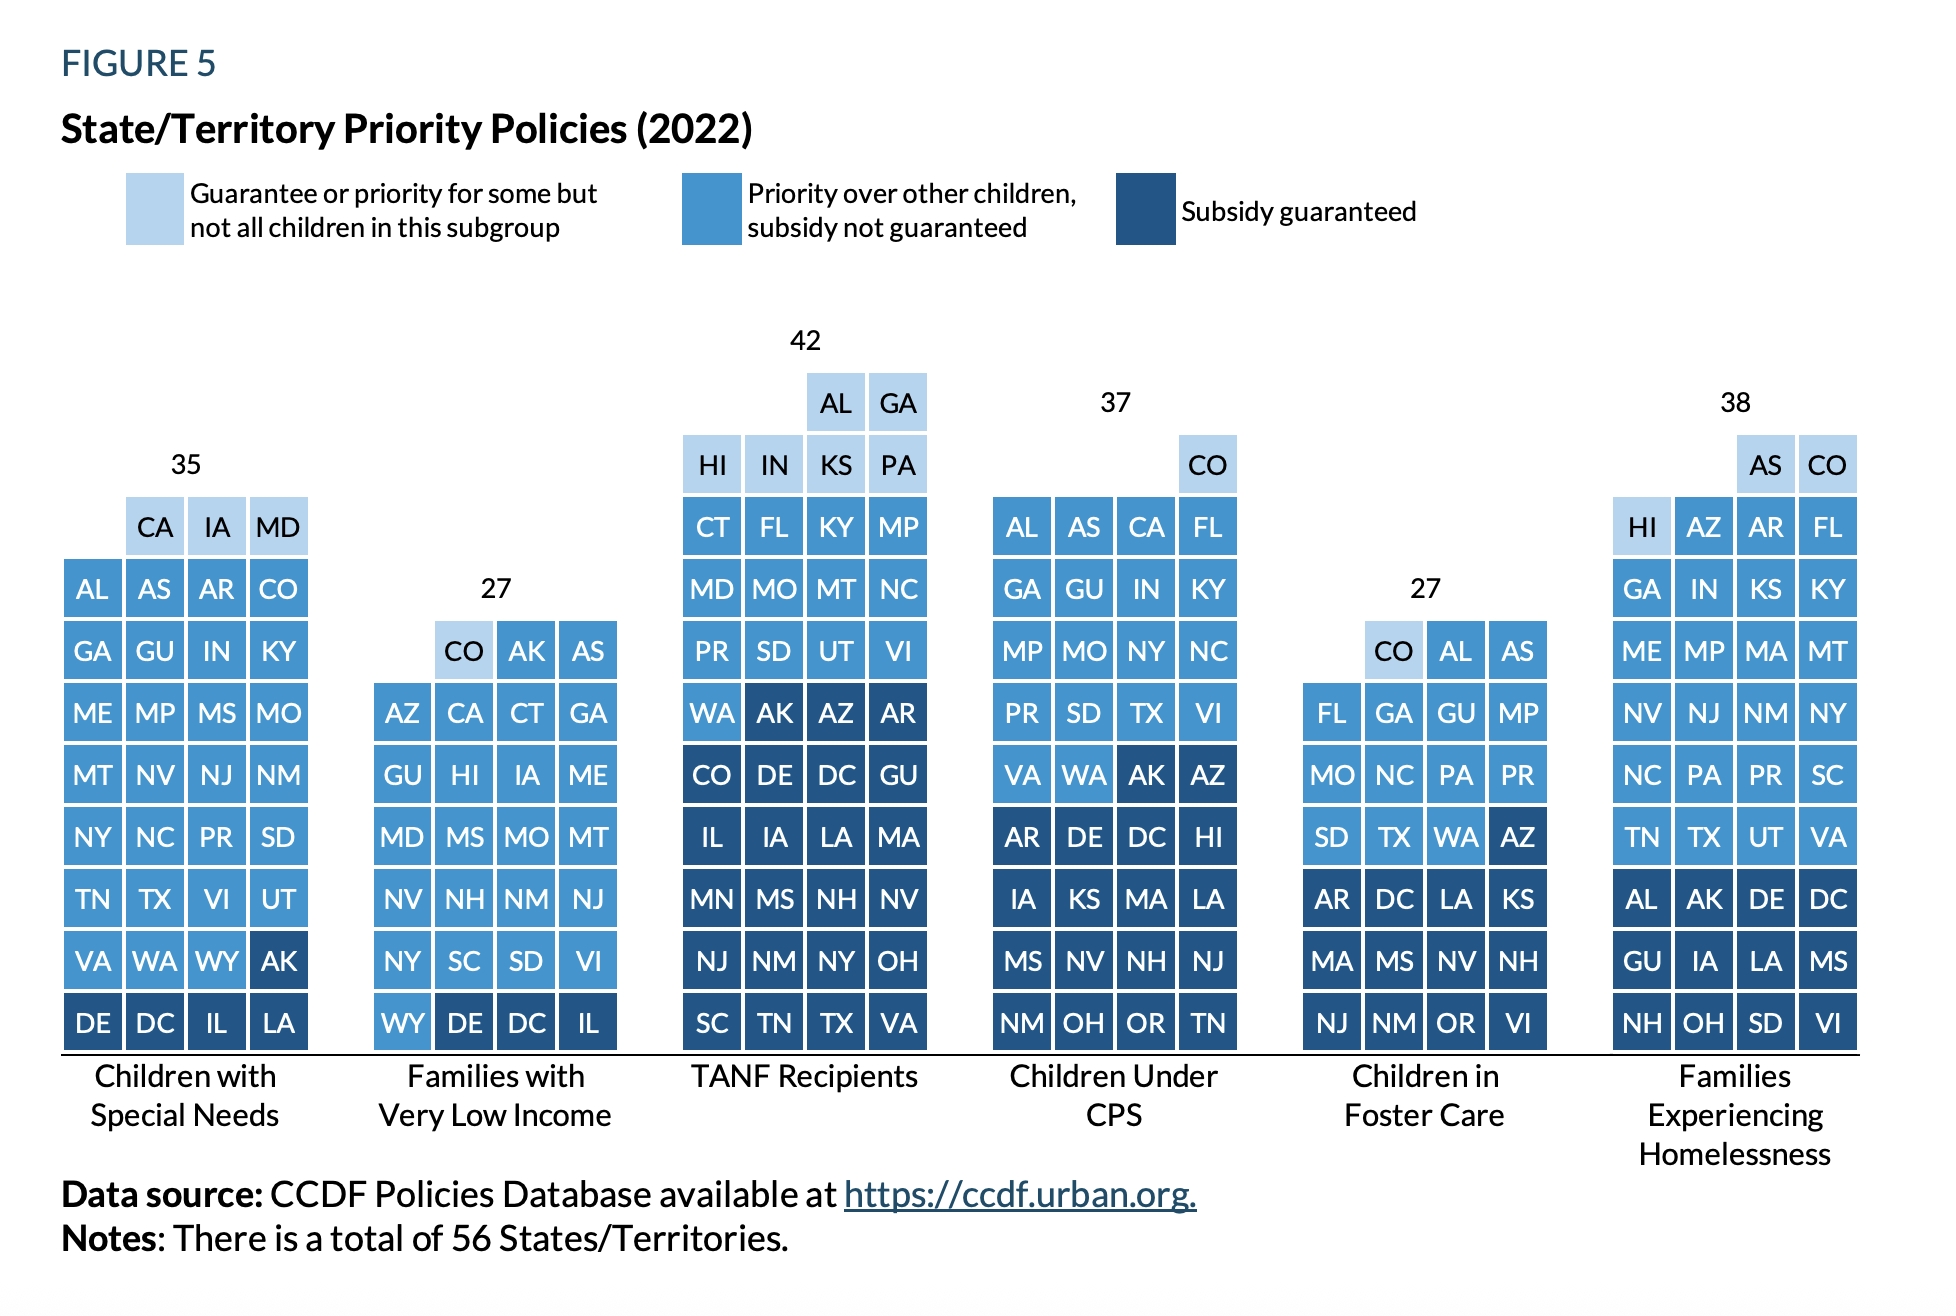
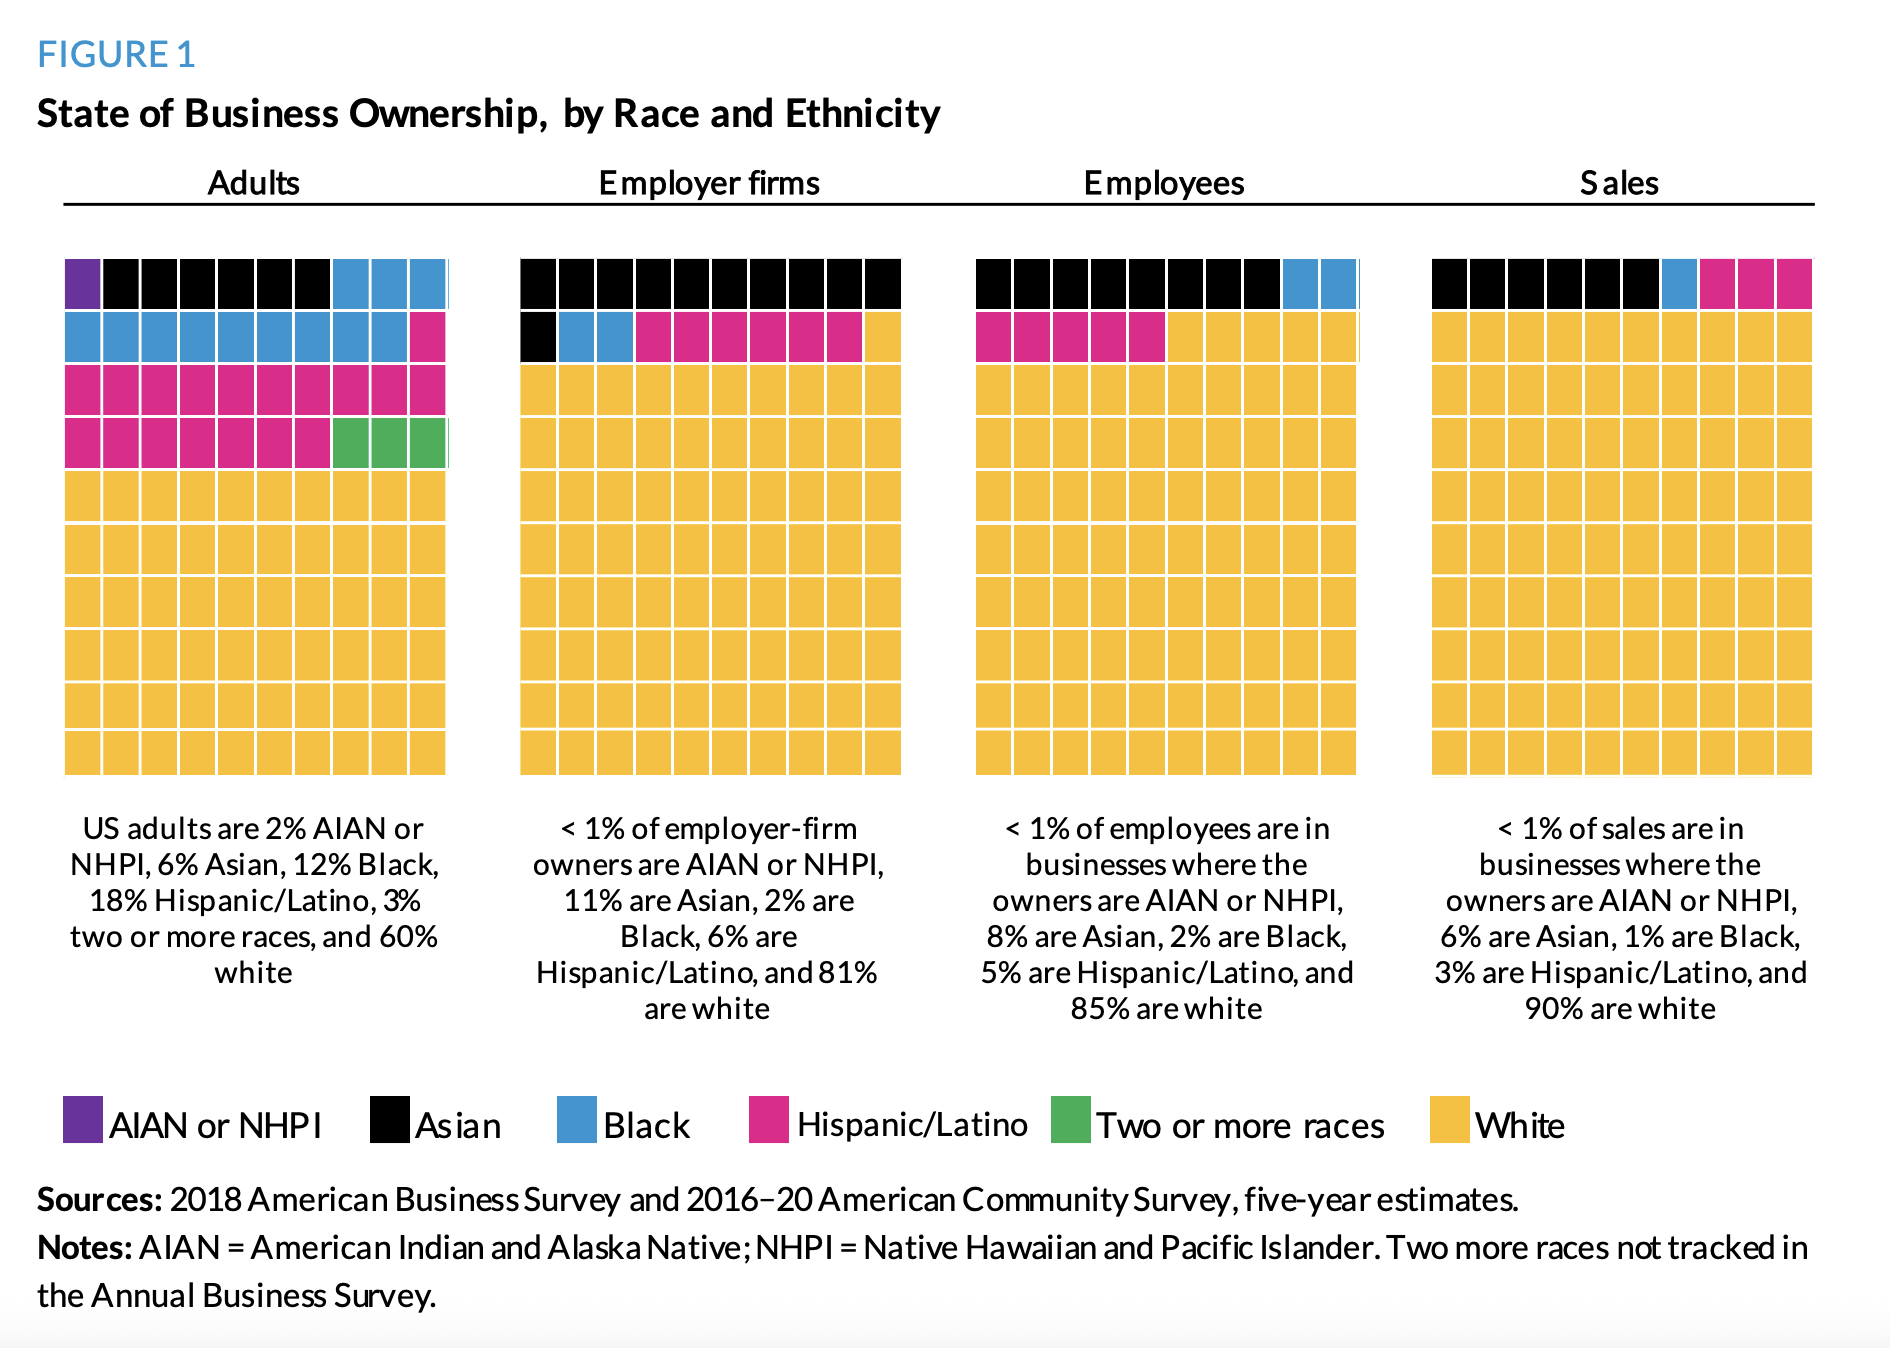
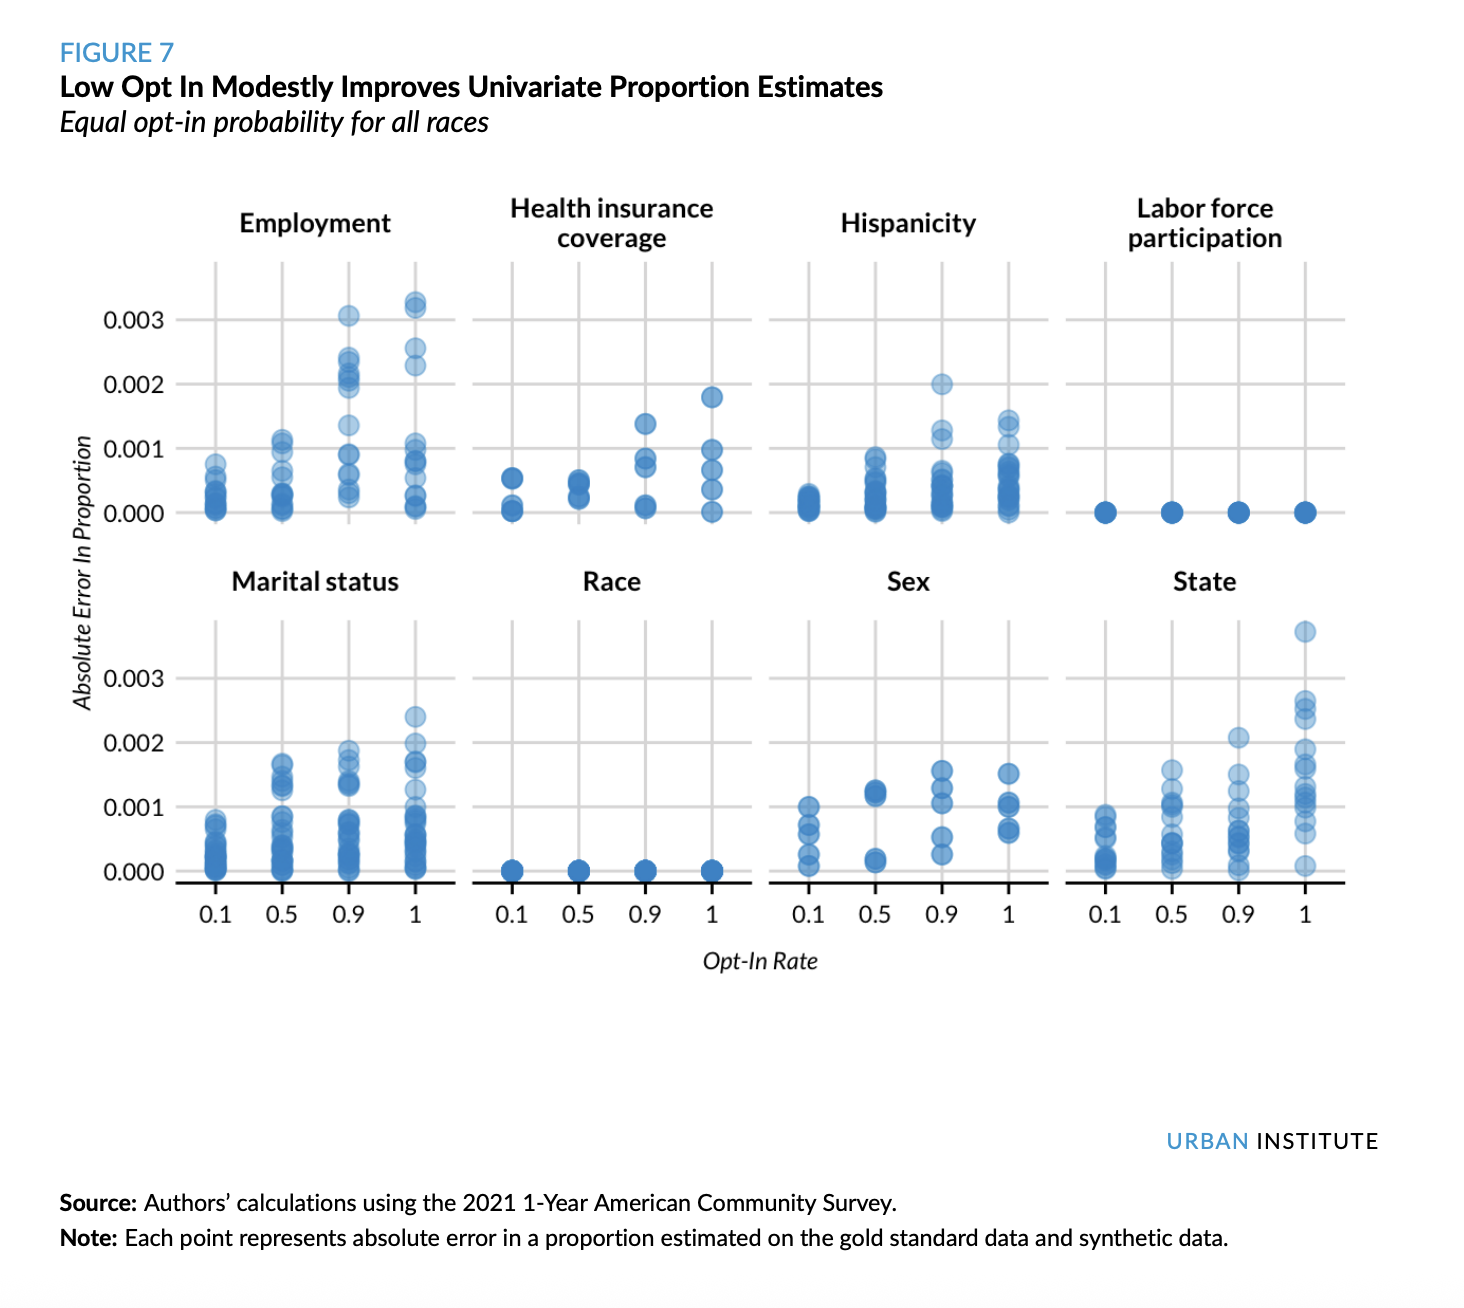
Small multiples. The small multiples approach is exactly what it sounds like: create a series of smaller graphs positioned in close proximity. Breaking a single larger, complex graph into smaller pieces can not only make a complex graph easier for readers to comprehend but also help create a sense of movement by aligning changes over time in a particular order.
There are two primary guidelines to follow when creating a small multiples visualization. First, each multiple should be the same type, shape, and size and use the same type of scales, which should start and end at the same values. The best way to think about small multiples is to take a single, dense graph and break it up into many charts—in other words, the framing elements of the chart should not change. Second, try to order the small multiple graphs in a meaningful way—for example, by some value, geographic location, or even alphabetically.
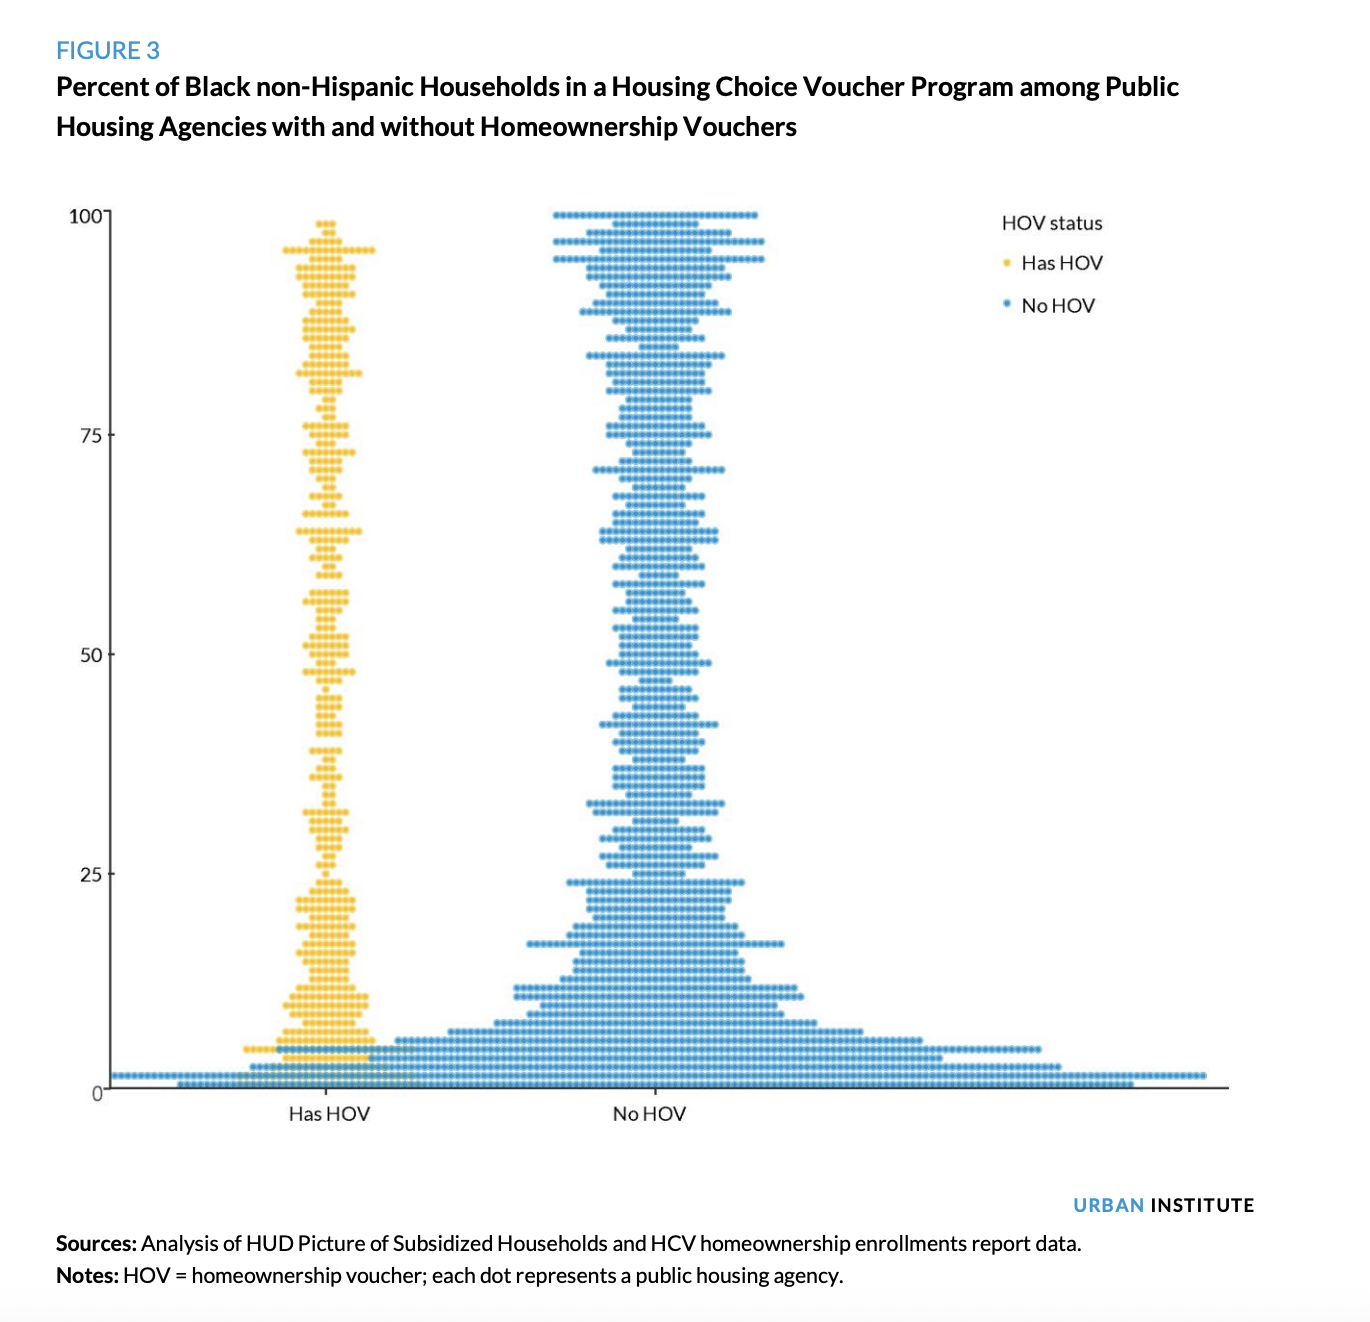
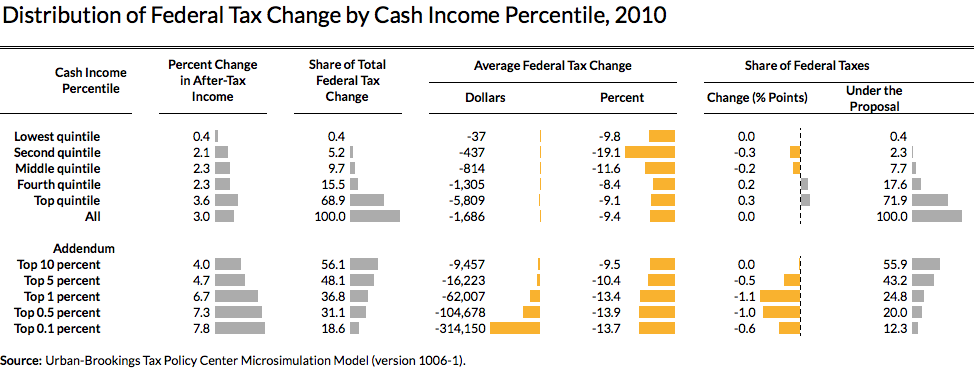
Highlighting. Highlighting can call attention to specific data points in very dense charts. The observations you want the reader to focus on should be rendered in a color that helps them stand out (usually pink or yellow at Urban), while the rest of the series are in a different color (usually blue, black, or gray). However, be selective with your use of color to highlight specific values, series, or observations, because too many colors can make it difficult to pick out the values on which you want your reader to focus.
Reference lines. There may be times when you want to include a reference line or pointer for a specific event, threshold, or benchmark. In such cases, make sure that your line is measured precisely. For example, if you are marking June 2010 in a line chart, the reference line should be located halfway between 2010 and 2011.
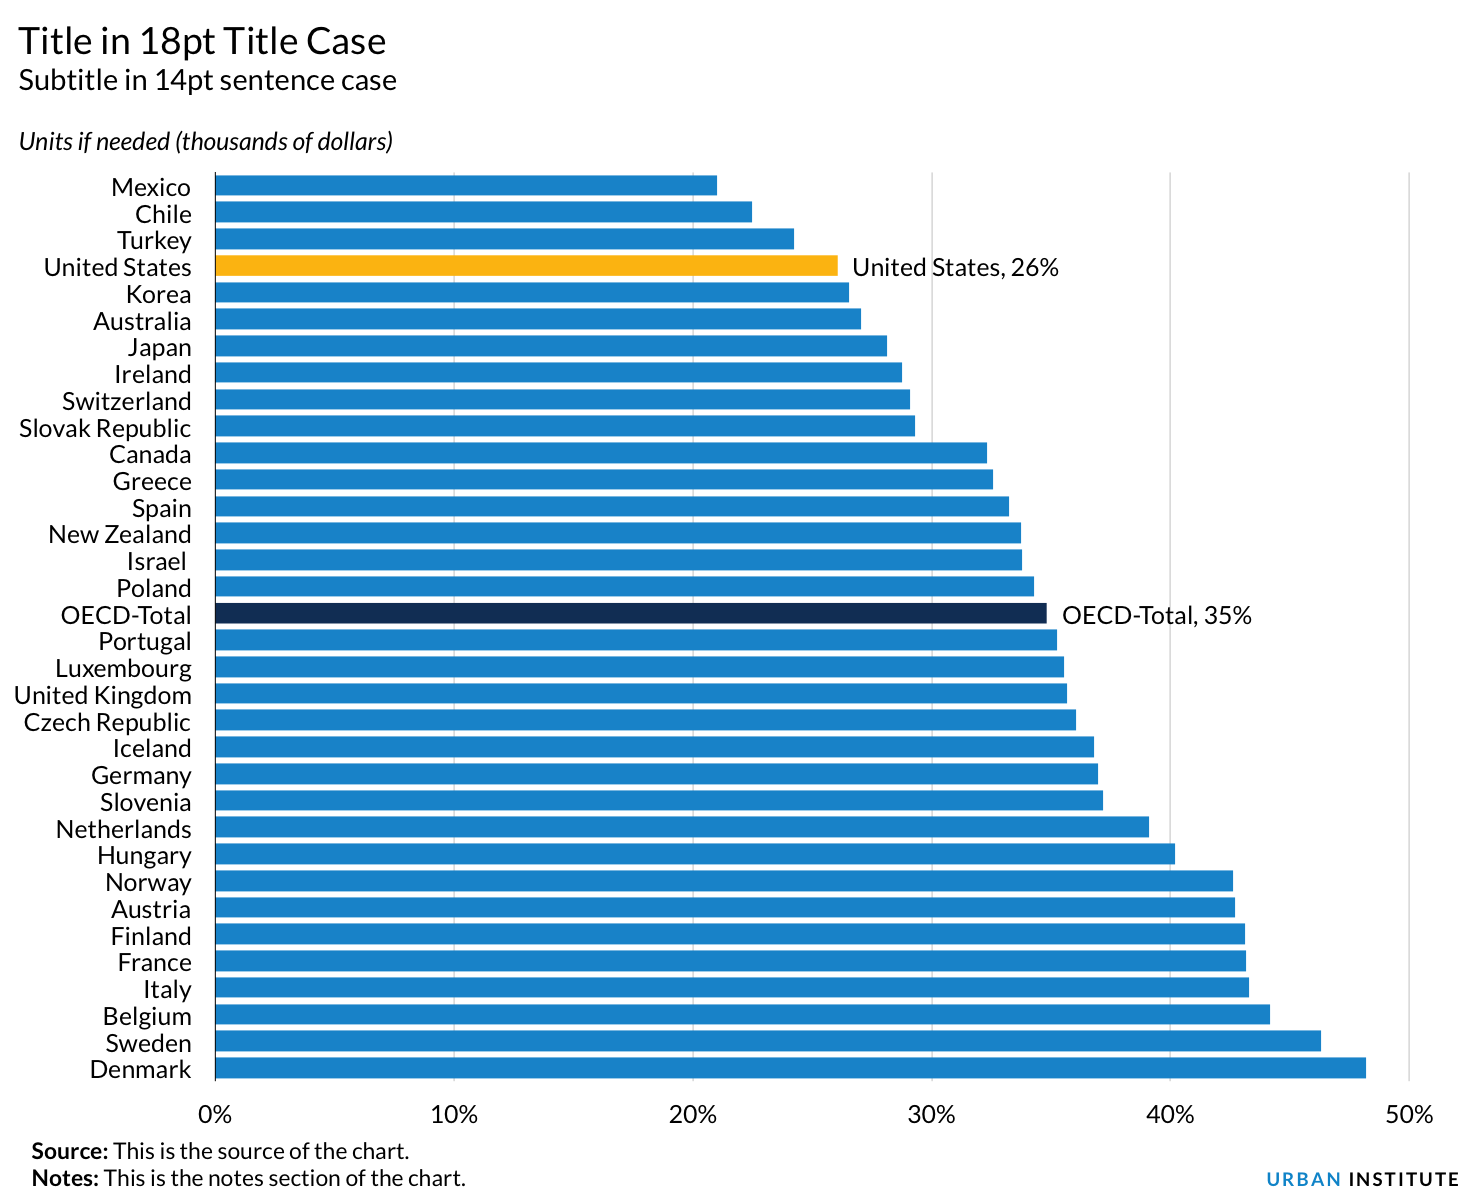
Titles. Use active, concise titles. For example, instead of a purely descriptive title, such as “Labor Force Participation Rate, Men and Women, 1950–2019,” a more active title would be “The Labor Force Participation Rate Has Declined for Men and Increased for Women.” Subtitles can be used to denote specifics about the data, such as time periods, frequency, units, or geography.
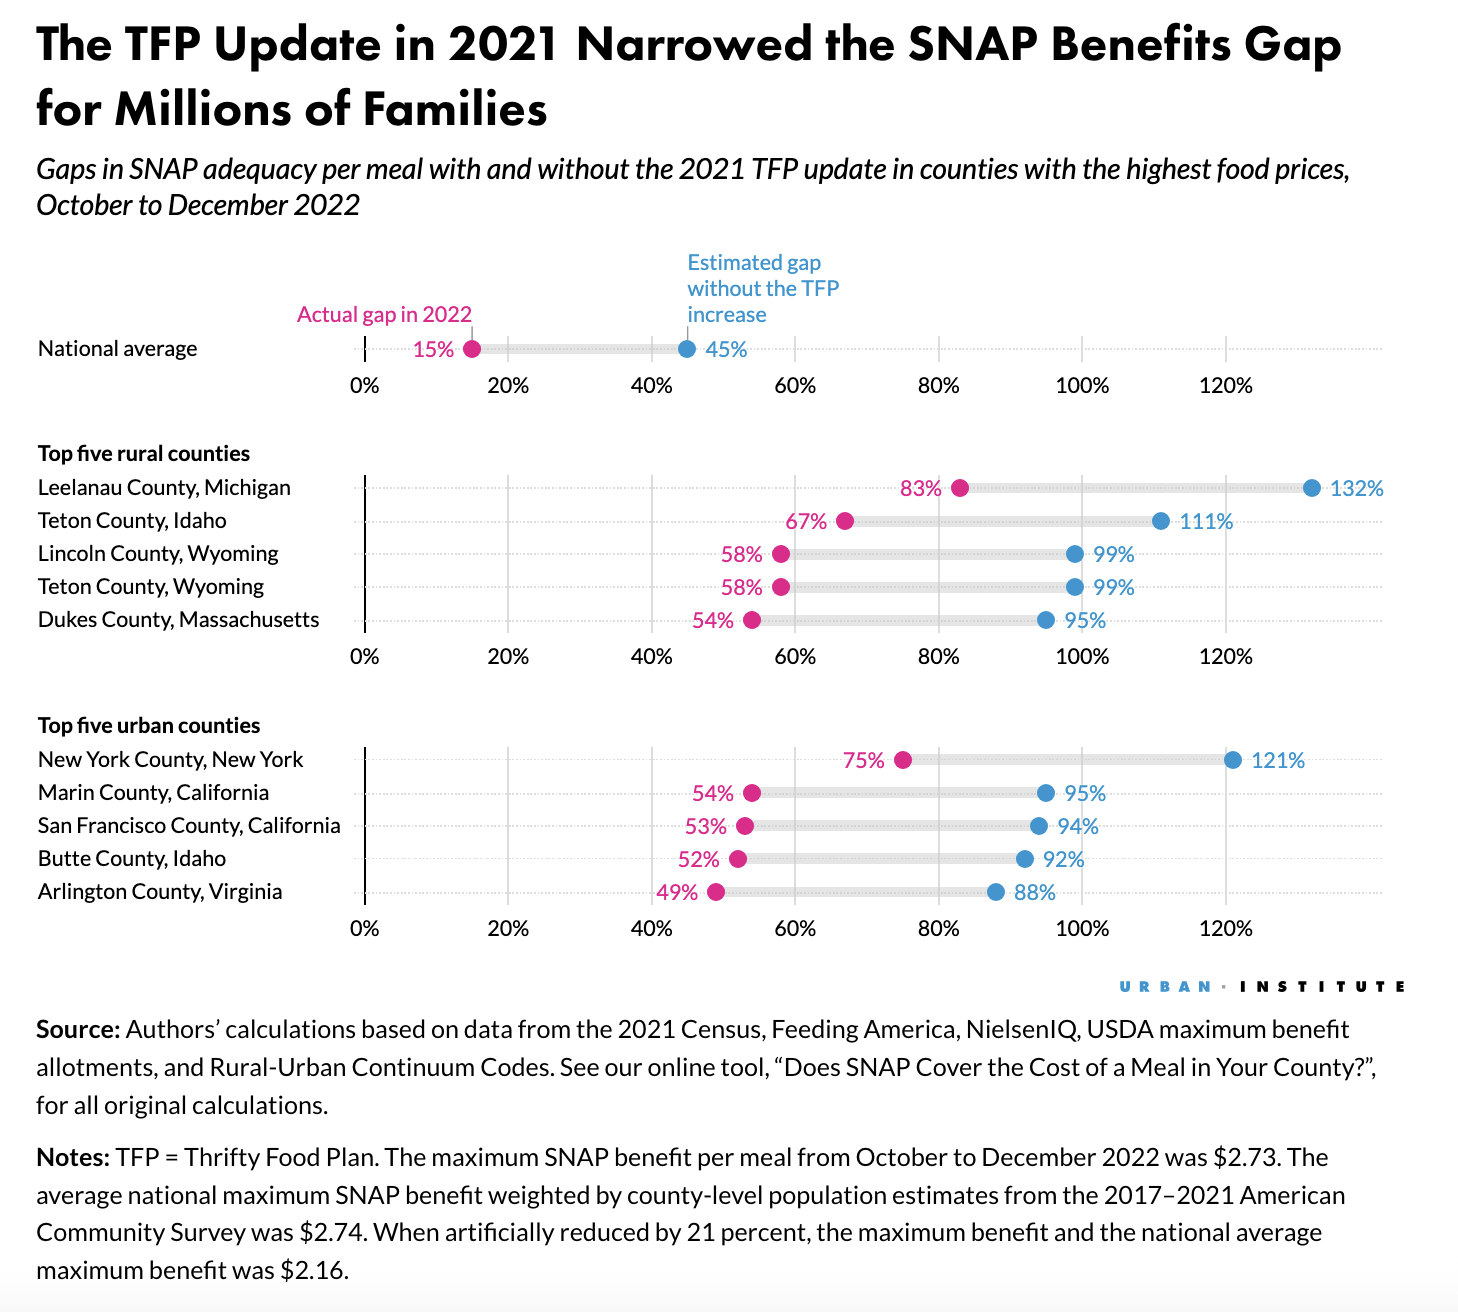
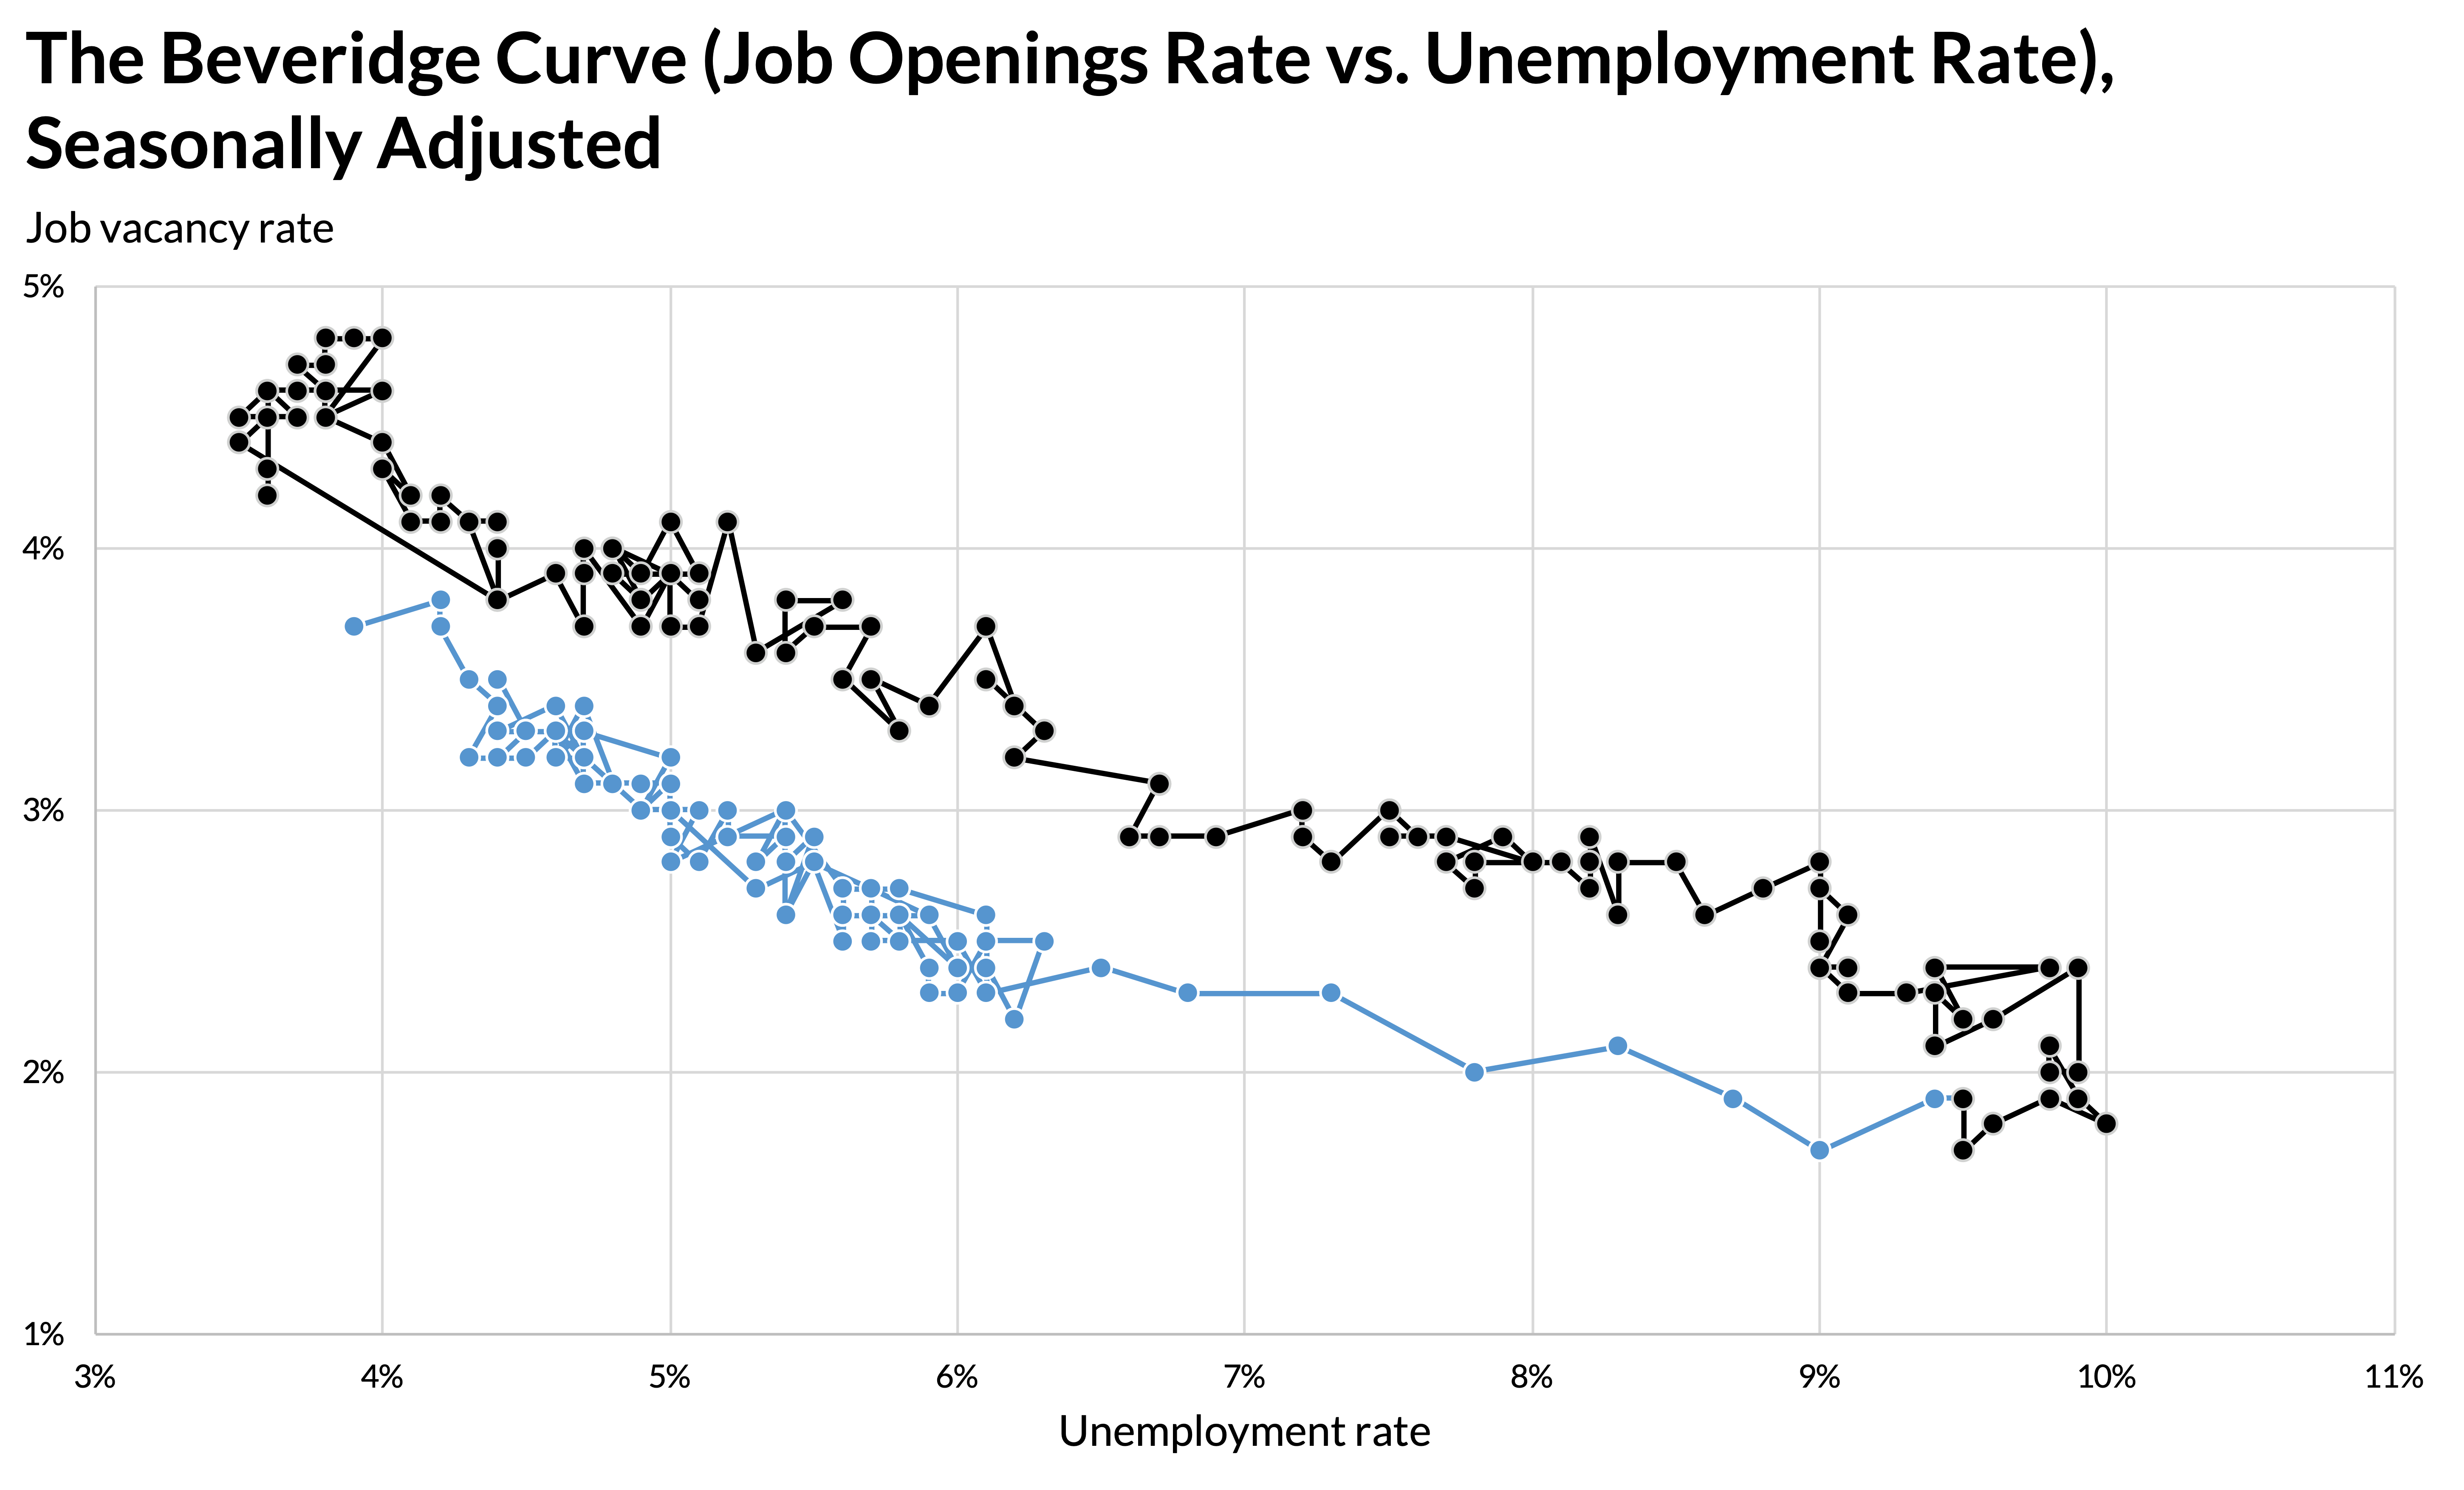
Annotation. Annotation is one of the most important ways to improve your data communication efforts. There are two primary ways to annotate your visualizations. First, adding explanatory text within the graph itself can highlight specific values or explain content. Second, you can add a layer of annotation to explain how to read the graph. This approach can be especially useful for readers who may not be familiar with a particular graph type. For example, you could add a pointer that denotes how the values get larger or smaller along each axis in a scatterplot.
Data labels and markers. When possible, avoid using legends and instead directly label the data on the graph. Endeavor to evenly space and align the labels instead of scattering them around the graph, which can make it difficult for your reader to find the label and risks emphasizing one series or data value over another. On a line chart, for example, you might place the labels at the far right of the graph, slightly outside the graph space, but left-aligned.
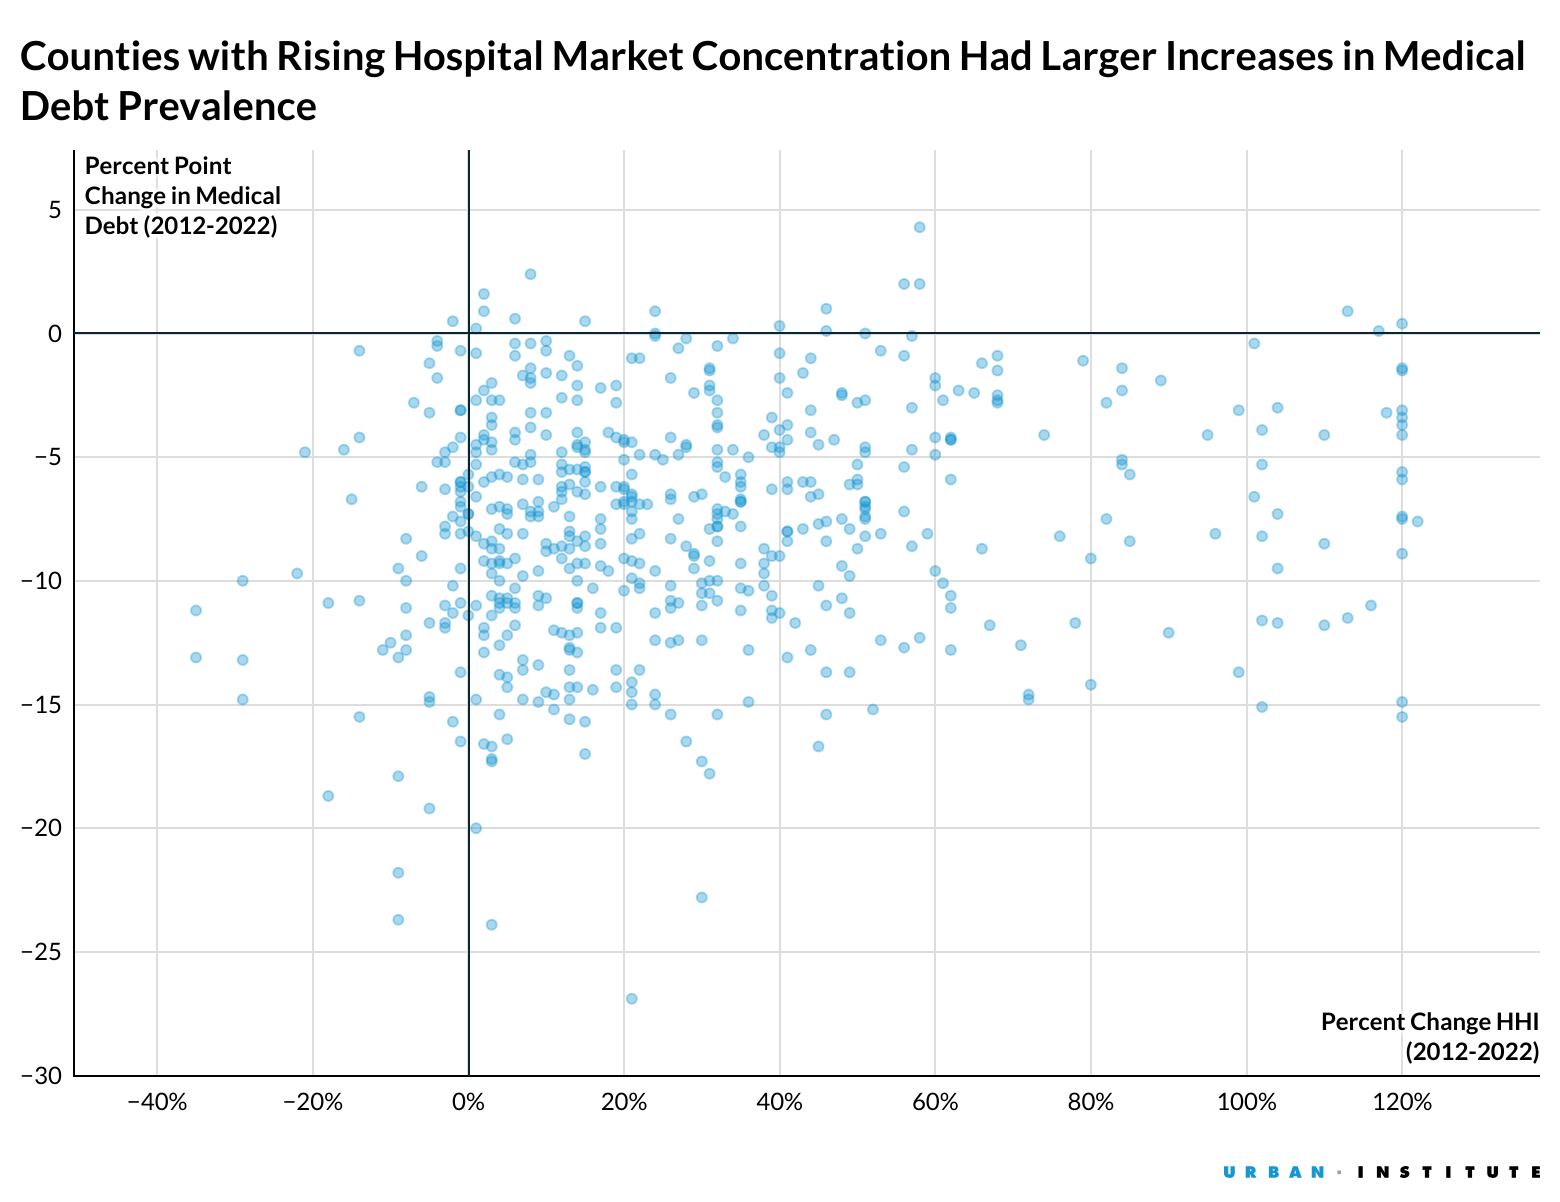
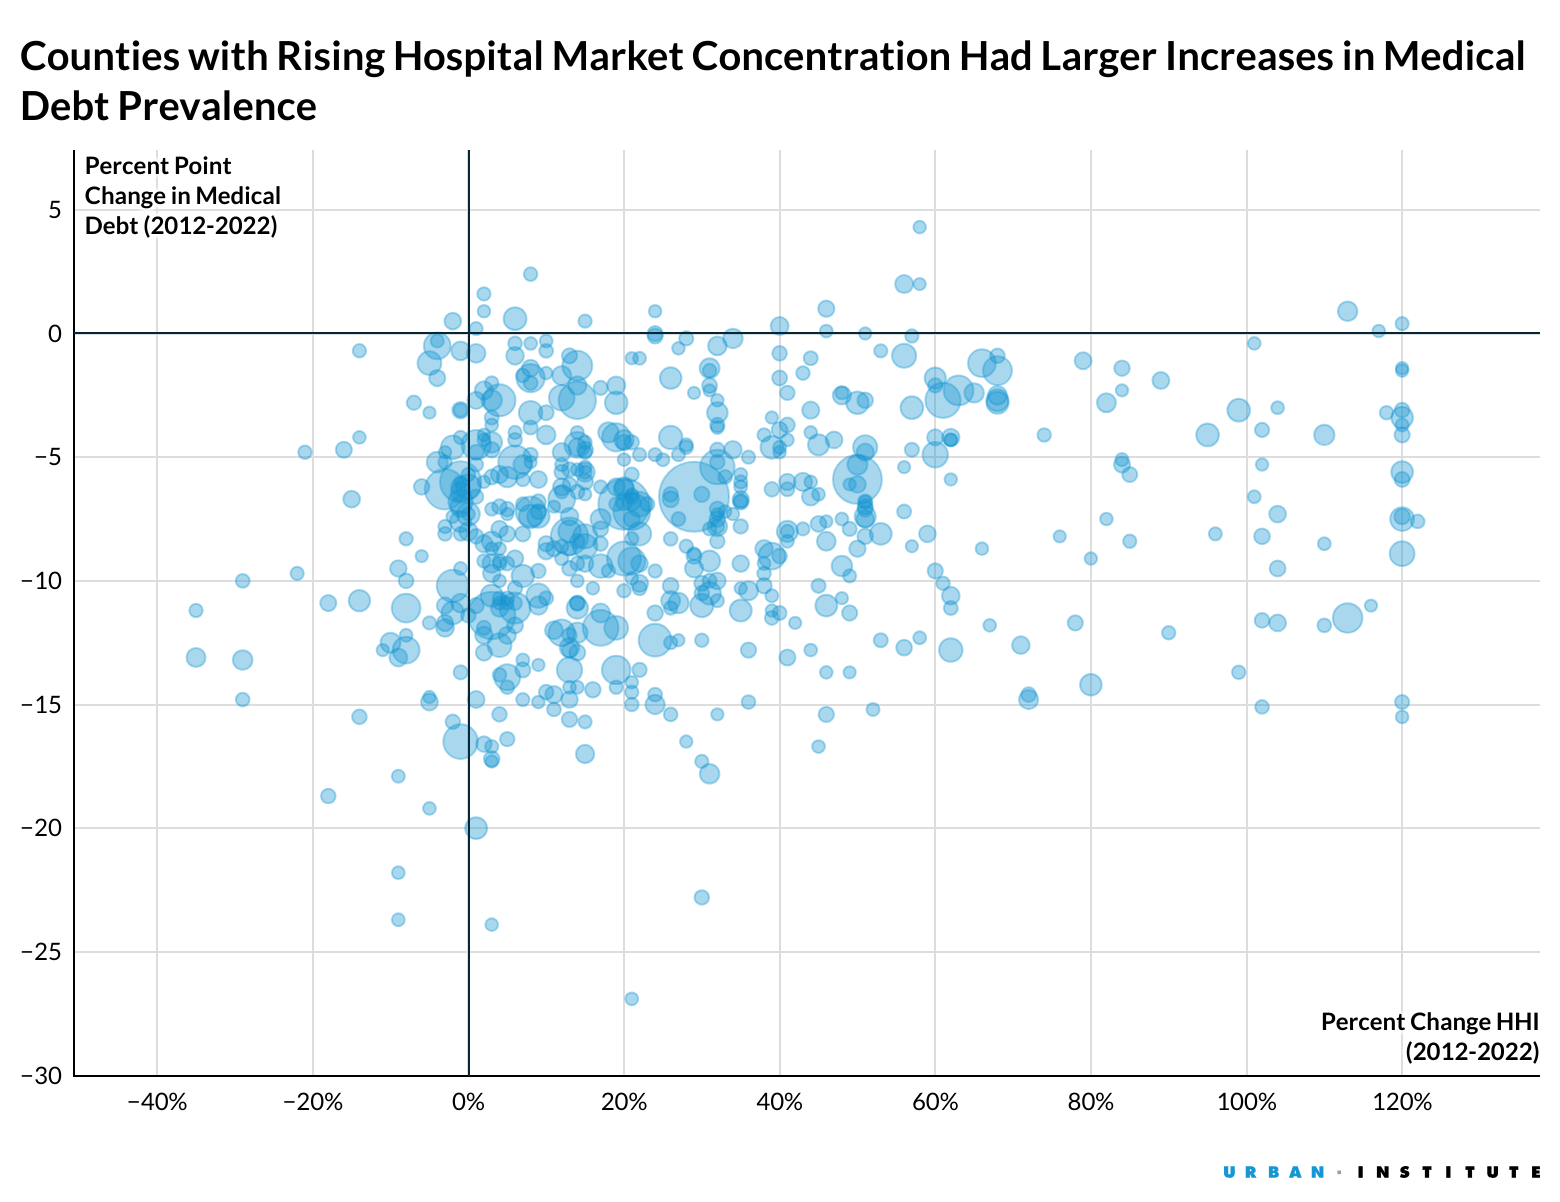
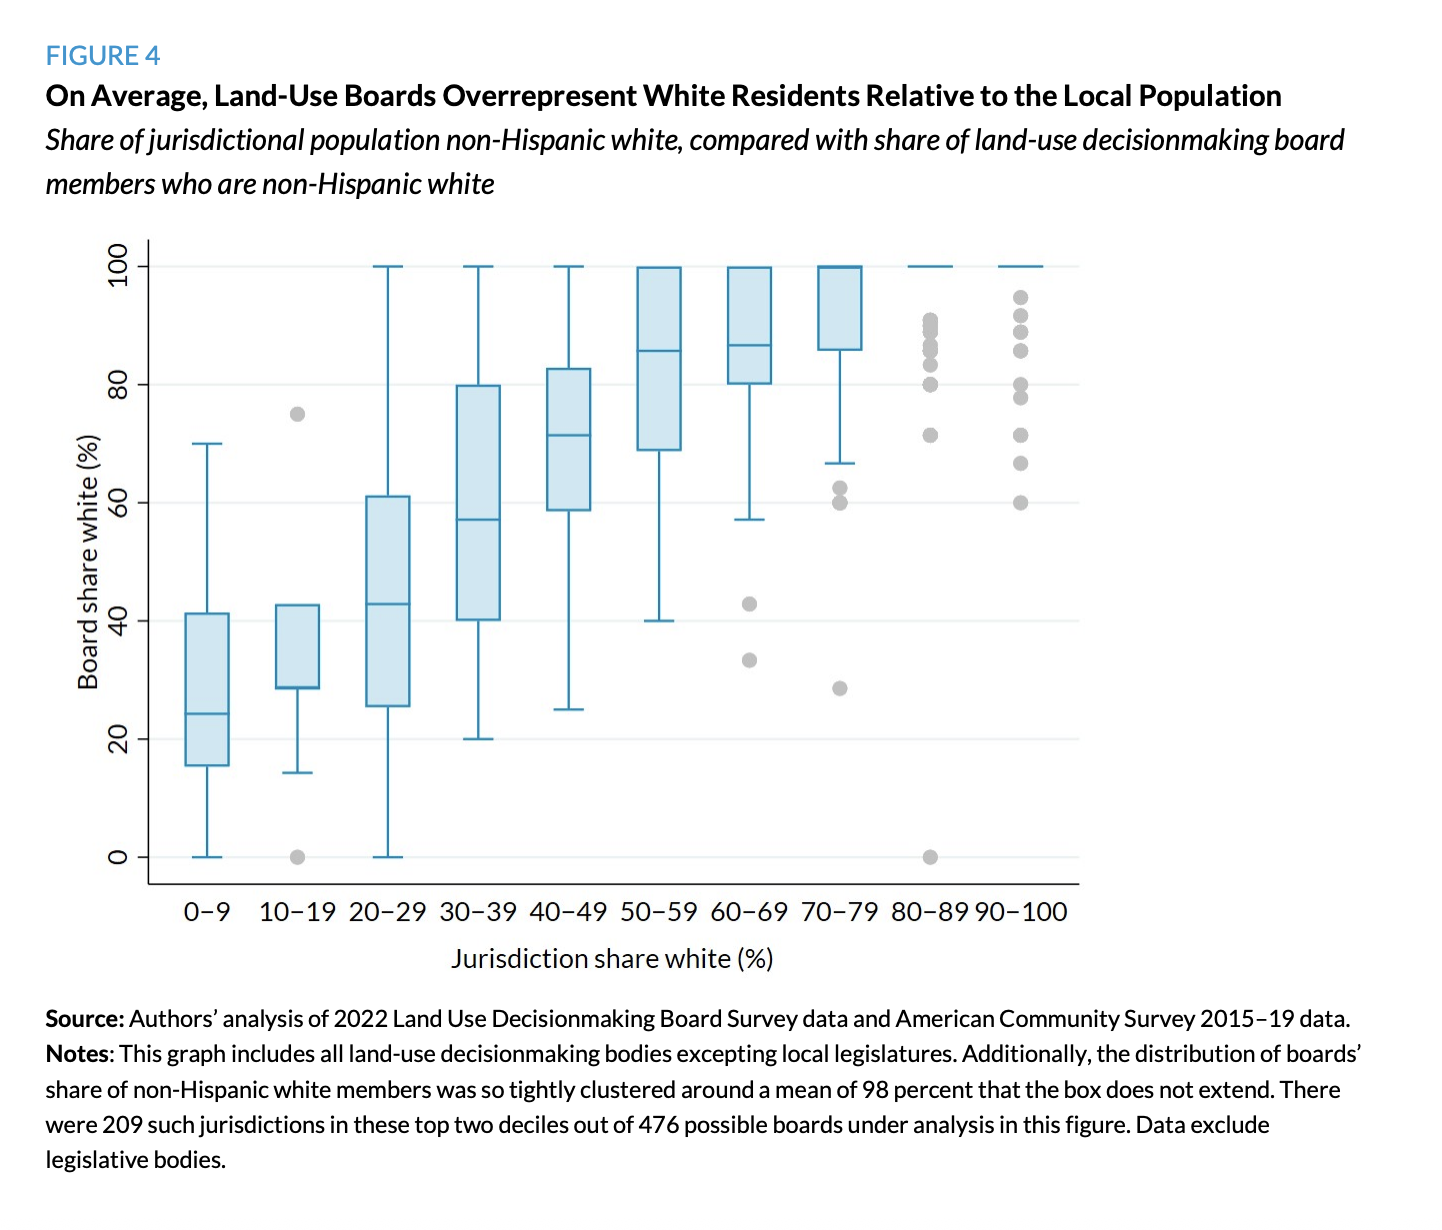
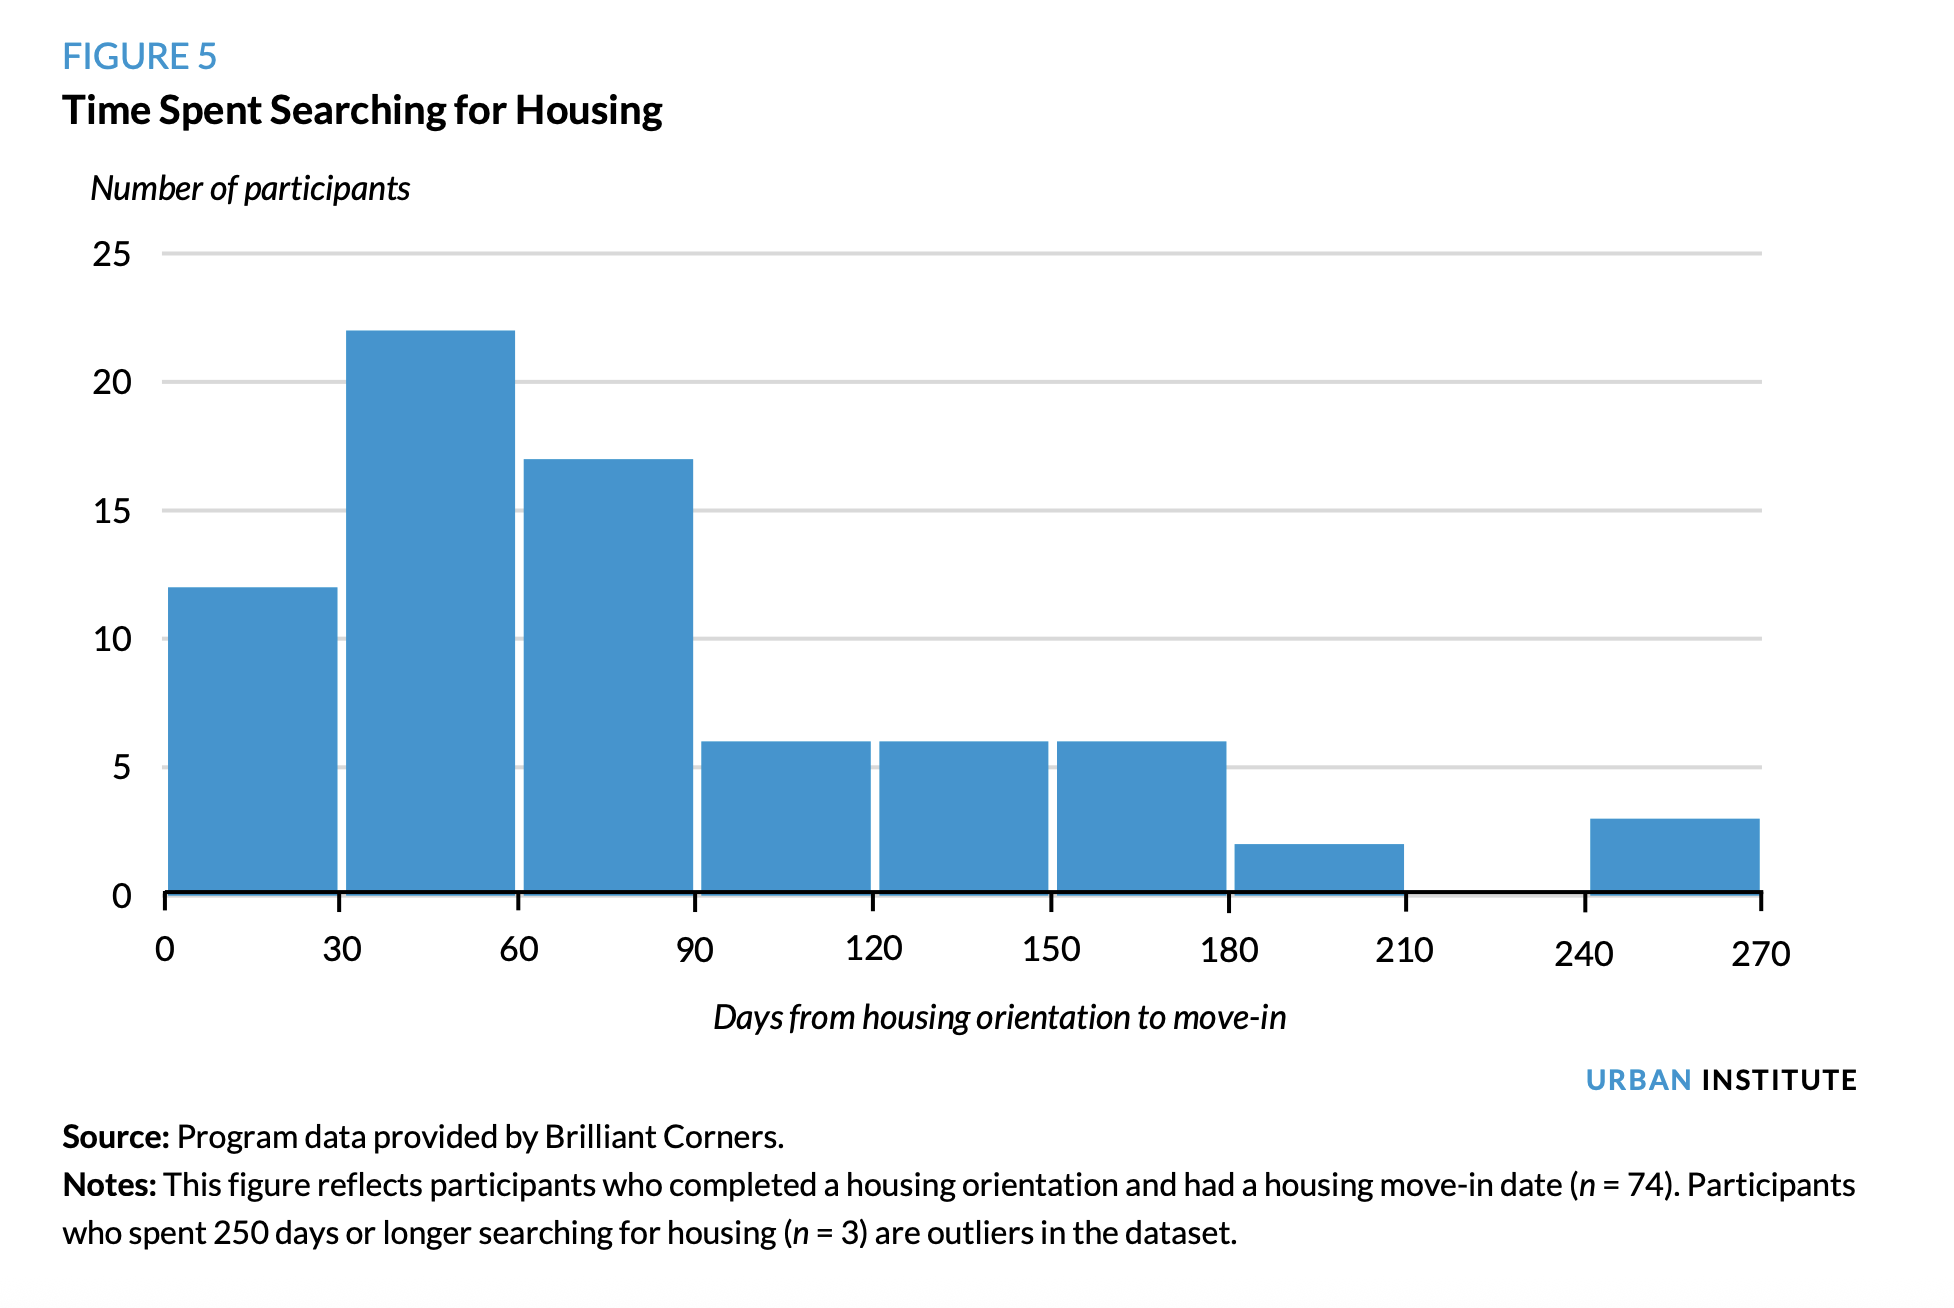
Marking outliers. Data values that are significantly different from others in your dataset may be considered outliers. In some sense, the statistical definition of an outlier is not necessarily important; a data value(s) may simply look like an outlier when plotted in your graph, which may require some explanation. Be careful with outliers, however; they can signify an interesting result or finding, but they may also indicate that something is wrong or mismeasured in the data.
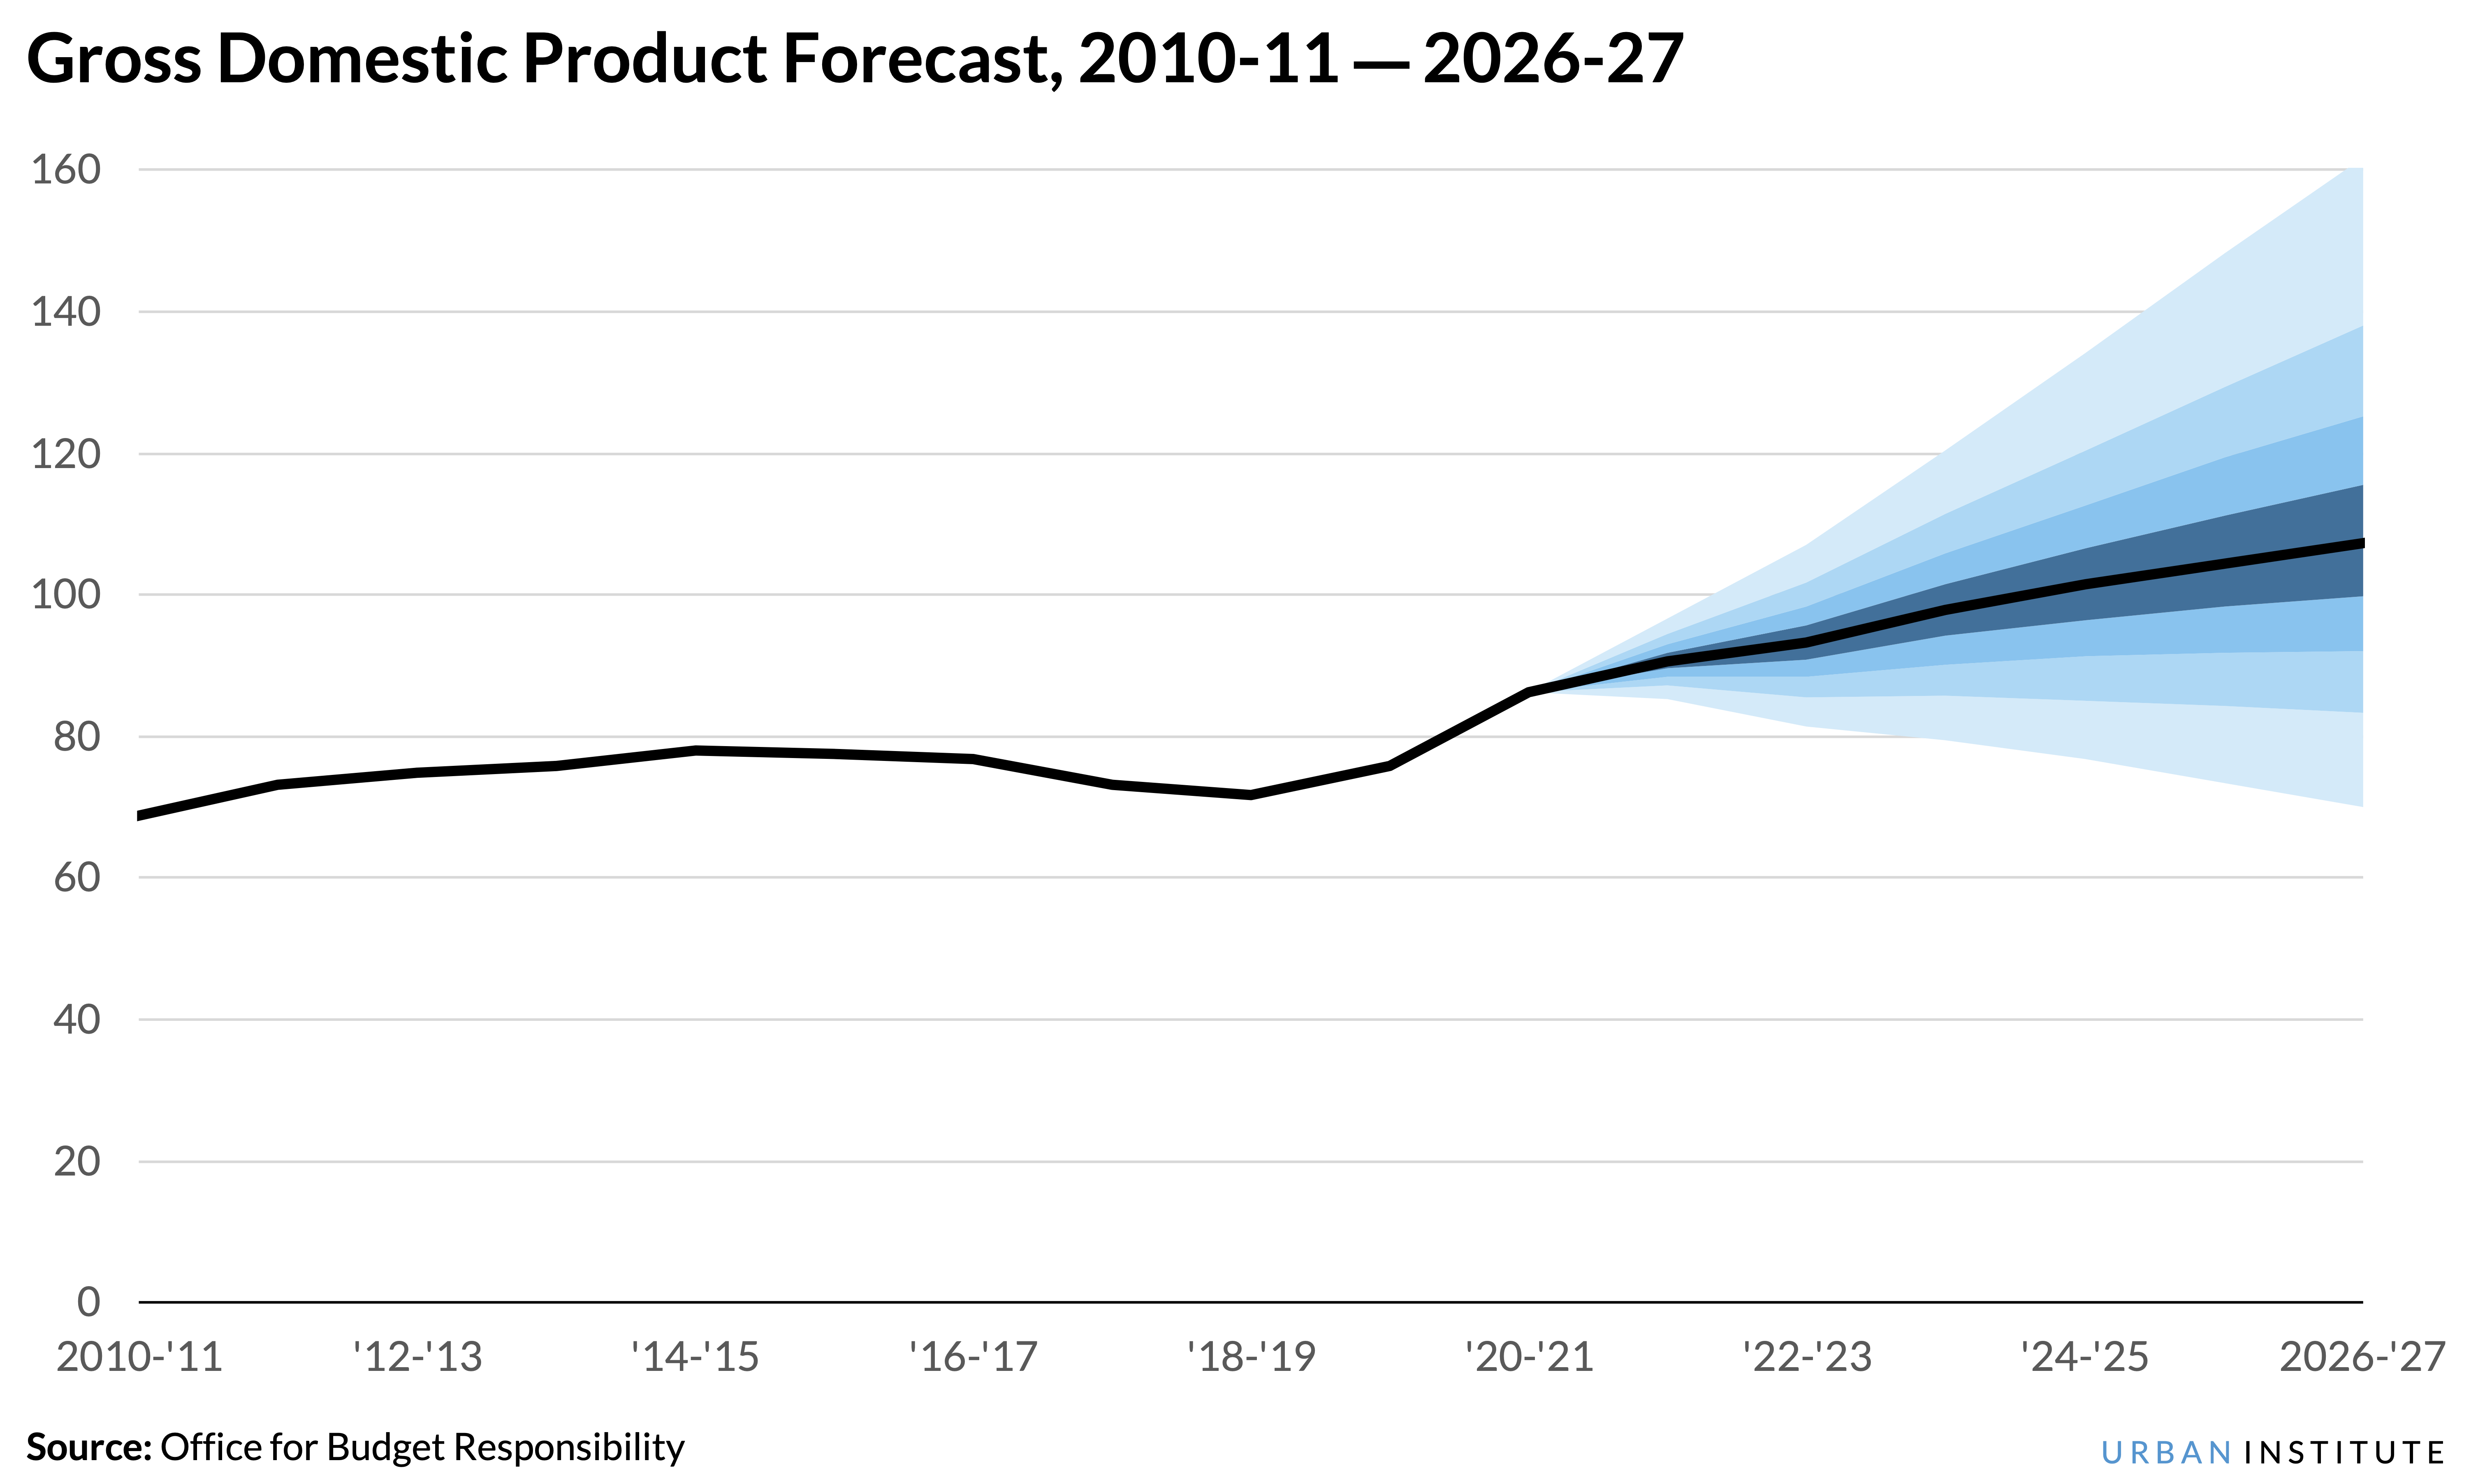
Showing uncertainty. Visualizations that depict distributions or uncertainty may be inherently difficult for many readers who are not familiar with the underlying data or statistical concepts. It is therefore important to clearly explain when certain data are missing or if there is uncertainty around certain estimates.
There are various kinds of data uncertainty. One form of uncertainty stems from randomness in the data. Small samples are a prime example of this kind of uncertainty. Consider a political poll that gives candidate Smith a 54 percent approval rating with a margin of error of plus or minus 4 percentage points. The poll has uncertainty because the dataset is only a sample of people who responded to the survey.
Another form of uncertainty comes from inaccurate, untrusted, imprecise, or unknown data. In some cases, we would be unable to address the uncertainty because we aren’t aware of it. In other cases, we could say our data are imprecise because, for example, it’s measured at an aggregate level; for example, infants’ ages captured in months rather than weeks.
Urban takes both kinds of uncertainty seriously, and researchers are best equipped to assess whether their data are unreliable. But knowing when to visualize different kinds of uncertainty is a different task and often depends on the knowledge and statistical sophistication of your reader.
Stay away from 3-D. There is no need to add a superfluous third dimension to your chart, particularly when you don’t have a third value. The 3-D effect available in many software tools actually distorts the data values because the effect is not actually 3-D but rather a perspective rendering of 3-D.
Be careful with data transformations. Log scales or other transformations can be useful for depicting rates of change or to address large outliers. The obvious trade-off is that many readers will not understand what a log transformation is and what it means. For example, everyone can understand what $150,000 of income means, but a logged value of 5.18 is not familiar to many readers. However, log scales can be an appropriate choice when the rate of change is more meaningful than absolute values.
Data Visualization Absolutes at Urban
The Urban Institute is committed to exploring and expanding how we create and engage audiences and readers through our visual display of information. While the practice of data visualization is a mixture of art and science with ample opportunity for creativity, there are certain data visualization practices that we avoid.
- Nonzero baselines. The axis in bar charts (whether vertical or horizontal) should always start at zero. The gaps between bars are overemphasized when the value axis starts at something other than zero. When small differences between bars are important to show but a zero axis makes those differences difficult for the reader to see, consider adjusting the data to show percent change, difference, or some other similar adjustment. It is important to note that other charts types that do not use length or height as the primary encoding—including, for example, scatterplots and line charts—do not necessarily need to start at zero.
- Dual axis charts. Charts that have two axes—where one series is tagged to one axis and another series is tagged to another, parallel axis—should be avoided. These kinds of charts are confusing, difficult to read, and are often misleading. There are several possible solutions to creating a dual axis chart, including multiple graphs (arrayed either horizontally or vertically); showing the percent change or another normalization; or using a different chart type such as a connected scatterplot. (There are two exceptions to this rule: charts that show the translation of a single measure such as Fahrenheit and Celsius temperatures; and the Pareto chart, which shows individual values as bars and a line showing the cumulative sum.)
- Pie charts with too many slices. This advice is purposely left unclear. There is no specific “rule” about how many slices are too many slices in a pie chart, but the general recommendation is to keep the overall number of slices in pie charts to fewer than 5. Humans cannot easily compare differently sized slices in pie charts, which reduces the effectiveness of the chart itself. In general, pie charts are best used when the slices of interest are values that generate right angles, which are familiar shapes, namely 25% and 75%, or a straight vertical line through the chart, namely 50%. While there may be exceptions to this guidance, Urban style is to avoid pie charts that have too many slices and are therefore difficult to understand.
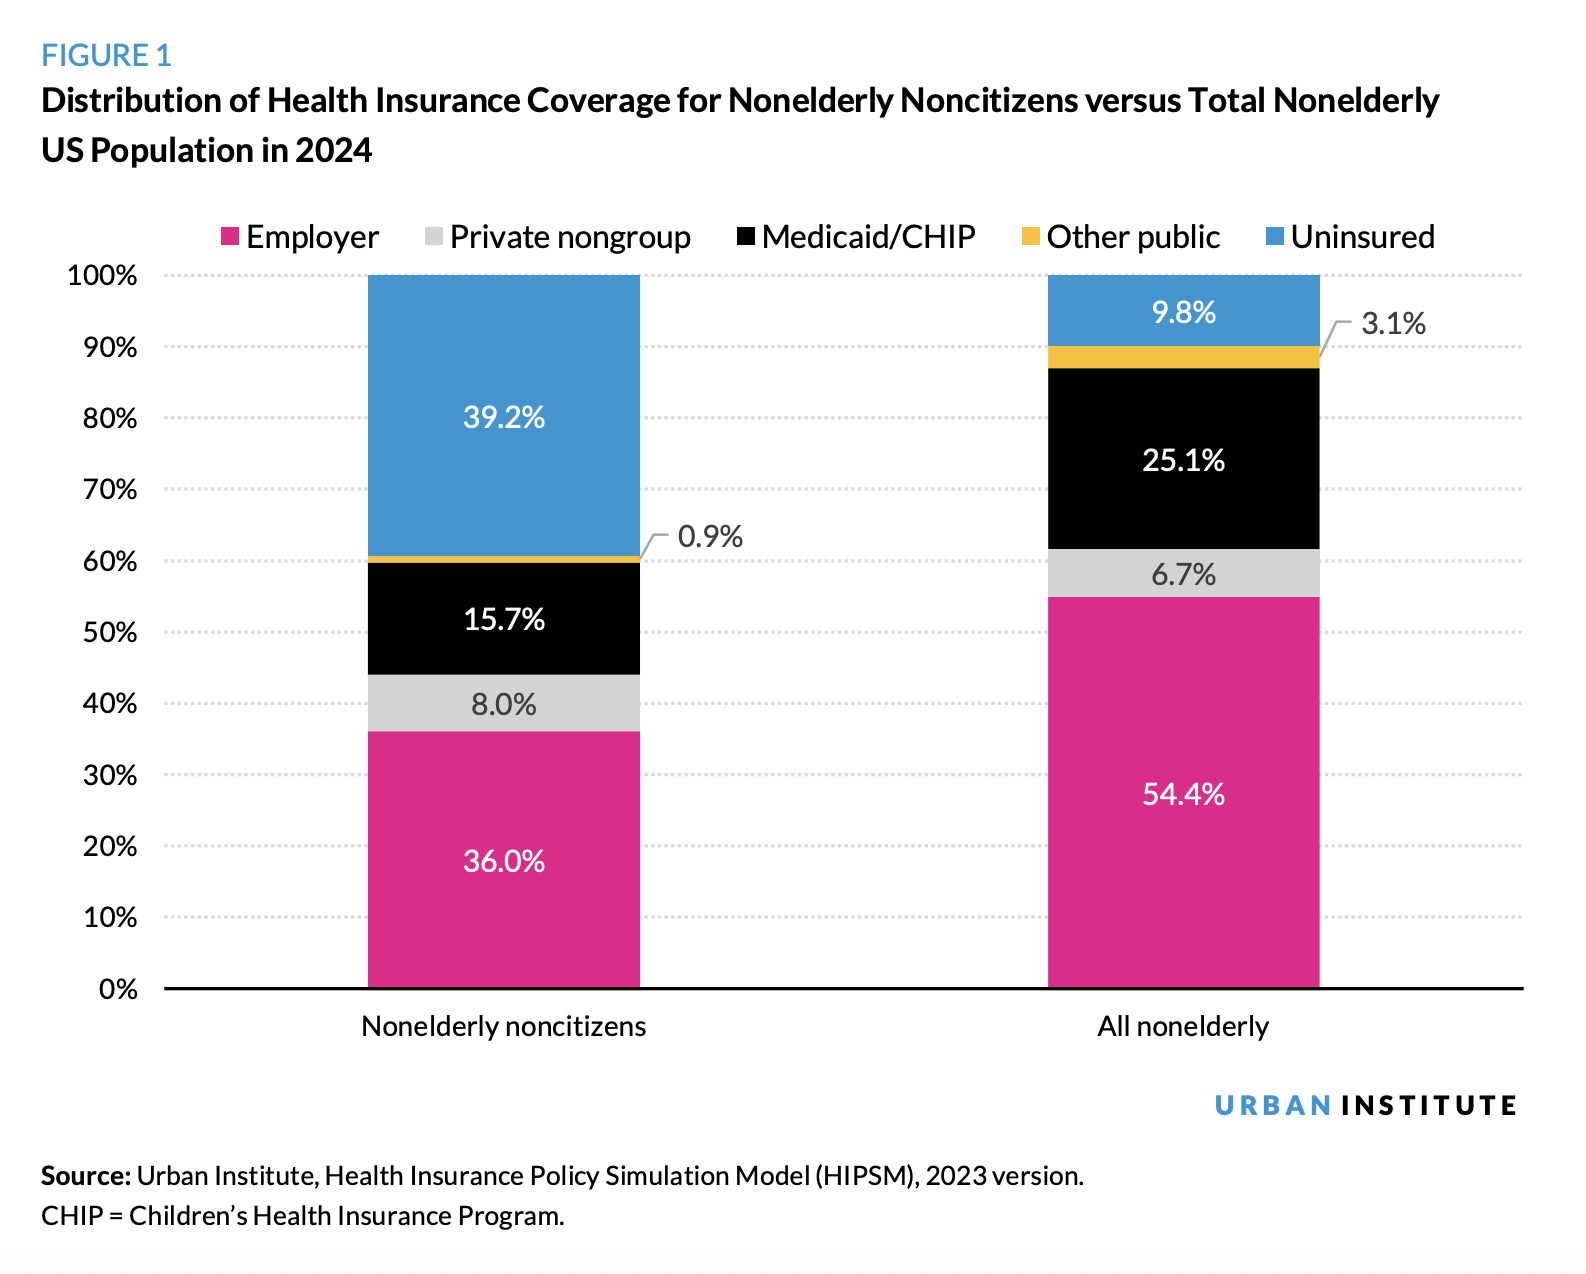
- Avoid too many categories. While the Urban color palette offers several hues and multiple tints and shades, our standard is to keep the number of categories in any graph to fewer than seven. Stacked bar/column charts, pie charts, line charts, and other charts with seven or more series/colors will look cluttered and be difficult to read. In these instances, fewer series or several multiple charts may be a better solution.